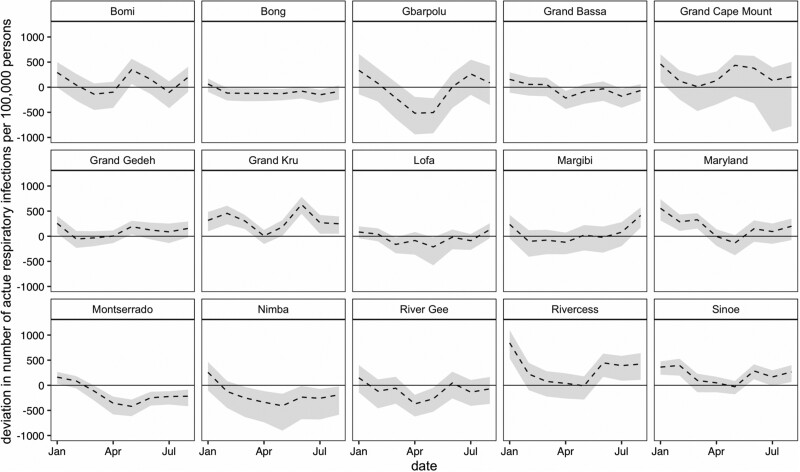
Figure 5.
Deviation in number of acute respiratory infections standardized per 100 000 persons in each county from January to August 2020. The black dotted lines represent the difference between the observed and predicted counts (deviation), with corresponding 95% prediction intervals in light grey. County population sizes scaled to account for excluded facilities.

