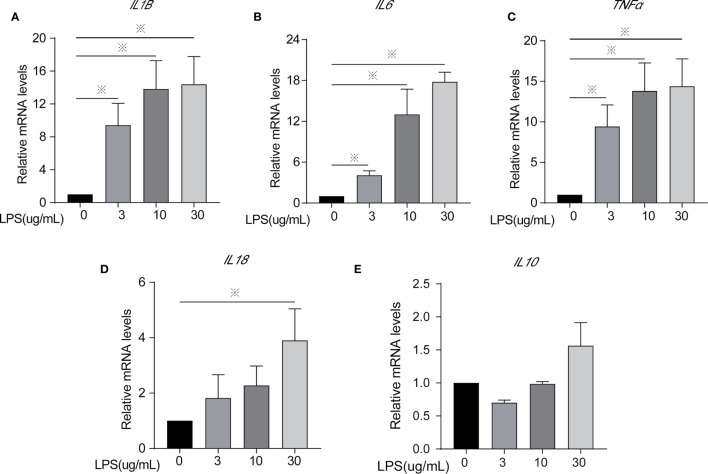
Figure 2.
Inflammatory cytokines mRNA expression of cells treated with different concentrations of LPS for 24 h. (A) IL1β, (B) IL6, (C) TNFα, (D) IL18, and (E) IL10. Each treatment had three samples (n = 3) and was repeated three times to reduce system errors; “※” means there was a significant difference (P < 0.05) compared with negative control (LPS, 0 µg/ml).

