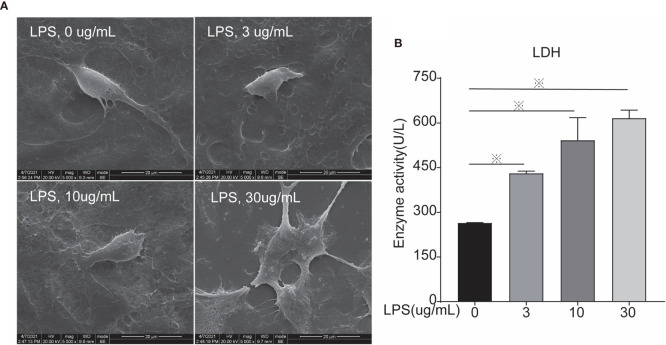
Figure 3.
Scanning Electron Microscopy and LDH activity of cells treated with different concentrations of LPS for 24 h. (A) Scanning electron microscopy, and (B) LDH. Each treatment had three samples (n = 3) and was repeated three times to reduce system errors; “※” means there was a significant difference (P < 0.05) compared with negative control (LPS, 0 µg/ml); scanning electron microscopy photographing magnification is 5,000 times, and the picture scale was 20 um.

