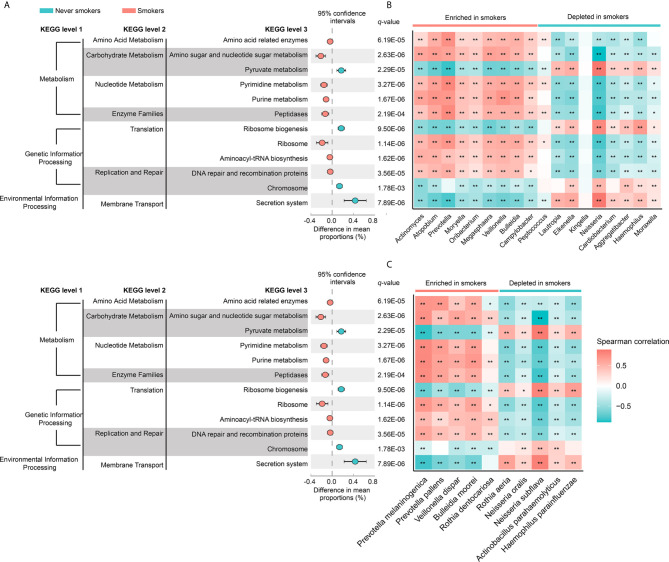
Figure 4.
(A) The different analysis of microbial community functions between never smokers and smokers (KEGG pathways average relative abundance > 1%). Difference in mean proportion for pathways showing significant difference in abundance are shown. The 95% confidence intervals and statistical significance (FDR q-value) are indicated as well. (B) Heatmap of spearman correlation between differentially abundant genera and above-mentioned pathways. (C) Heatmap of spearman correlation between differentially abundant species and above-mentioned pathways. The strength of the color depicts the Spearman’s correlation coefficients (negative score, blue; positive score, red). *P < 0.05, **P < 0.01.

