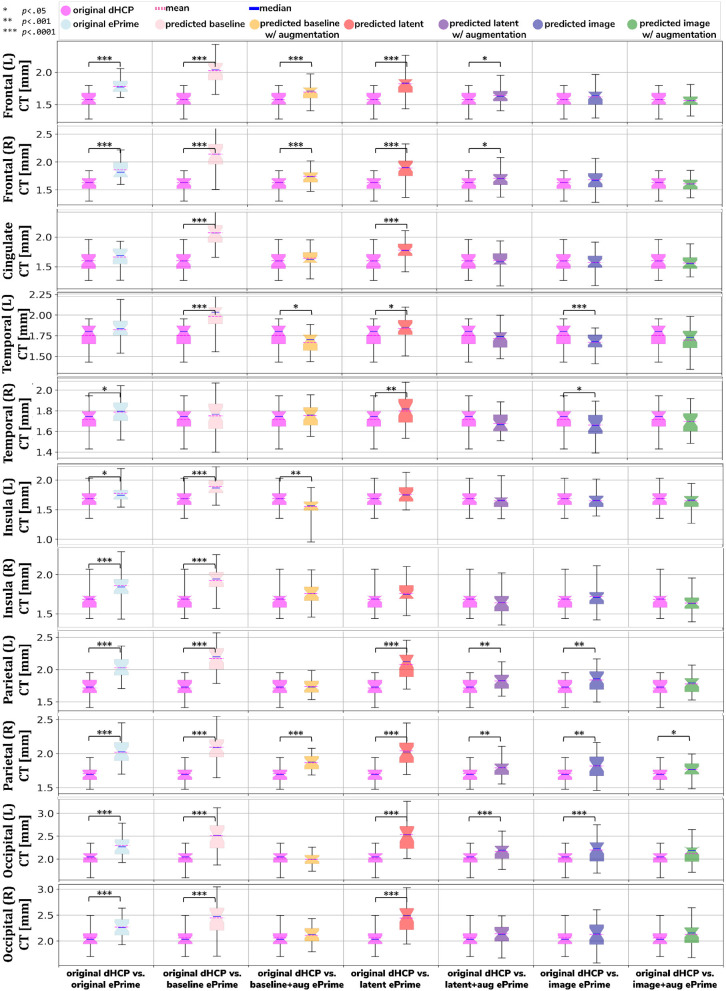
Figure 8.
Comparison of local mean cortical thickness measures between original Draw-EM dHCP segmentations and original Draw-EM ePrime segmentations (first column), or between original Draw-EM dHCP segmentations and ePrime segmentations obtained with the six trained models (columns 2–7). Linear regressions were performed in the comparable data subsets testing the effects of cohort on local cortical thickness measures, controlling for PMA, GA, and sex (CT ~ cohort + PMA + GA + sex). The asterisks indicate a statistically significant effect of cohort in the linear regression.

