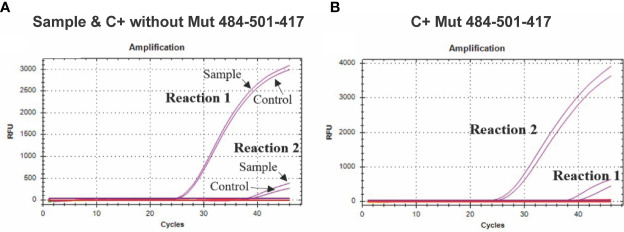
Figure 3.
Amplification curves for the K417N assay. (A) The curves of four independent reactions are shown; the purple curves with a lower Cq value show the forward primer amplification directed to the sequence without K417N mutation (Reaction 1) in a sample of COVID-19 patients or control C+ without-Mut. In comparison, the signal with a higher Cq value shows the amplification when using the primer directed to the sequence that presents the mutation (Reaction 2), which presents an evident lag, in comparison to the first reaction. (B) The purple curves with a lower Cq value show the amplification of the forward primer directed to the K417N mutation (417N Fw) (Reaction 2) using synthetic control C+ Mut484-501-417 (which contains the mutation). In comparison, the amplification curve with a higher Cq value shows the amplification when using the primer directed to the sequence that does not present the mutation (Reaction 1) using the same control.

