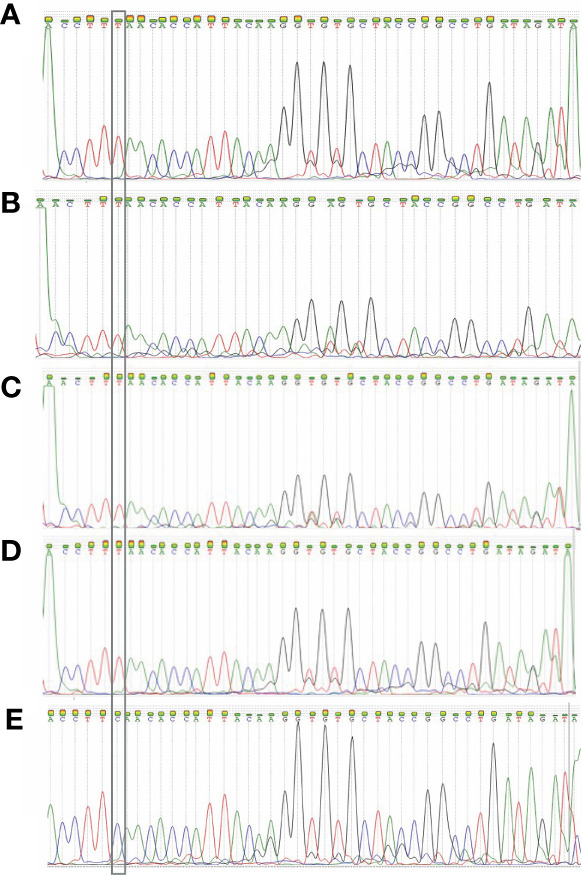
Figure 6.

Electropherograms obtained from the Sanger sequencing of four samples. (A) 150441 patient; (B) 150 450 patient; (C) 138227 patient; (D) 139093 patient; (E) L782 patient. The first 4 samples show the E484K mutation, and the fifth is a wild-type sample. The inset highlights the position of the mutation, which shows that the original base “C” changed to a “T”.
