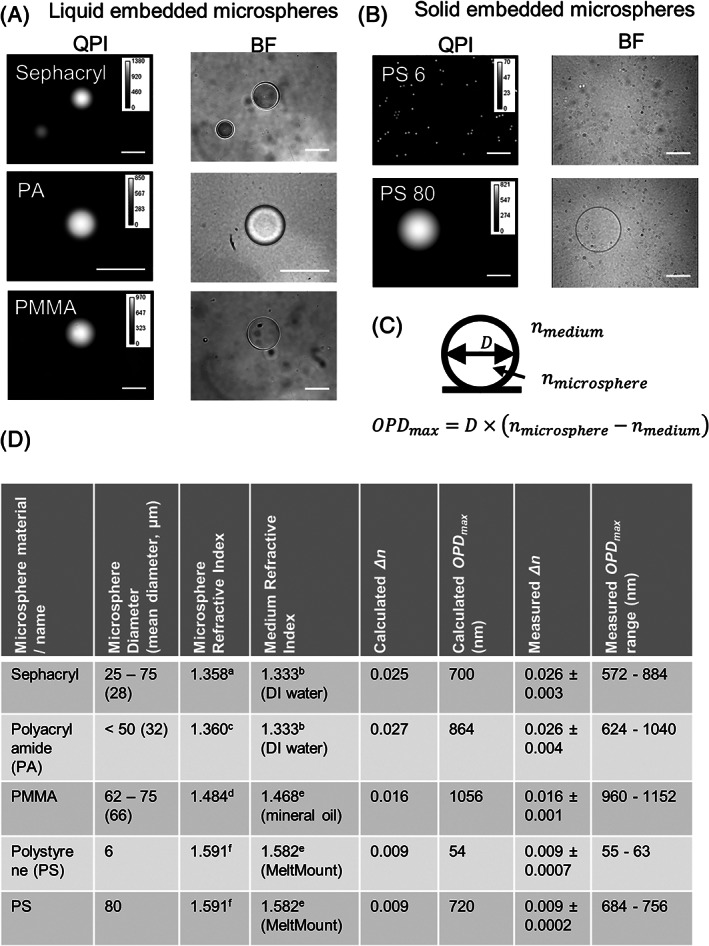
FIGURE 1.

Evaluation of microspheres embedded into liquid or solid immersion media using quantitative phase imaging (QPI). (A) QPI and bright field (BF) images of candidate microspheres dispersed into liquid immersion media. (B) QPI and BF images of polystyrene microspheres embedded into solid immersion media. (C) The measured Δn, which is nmicrosphere‐nmedium, was determined by dividing the microsphere diameter, D, by the maximum OPD, OPDmax, of the microsphere. The average Δn (± standard deviation) value for each microsphere/media combination was compiled for a minimum of 20 different microspheres. D was determined from the brightfield image and OPDmax was determined from the QPI image (see Methods section for analysis description). (D) Table of microsphere parameters both calculated and measured (λ = 590 nm) that show close agreement for change in refractive index (Δn) and optical phase difference (OPD). Scale bar for images in (A) and (B) is 50 μm. Phase shift shown in nm
