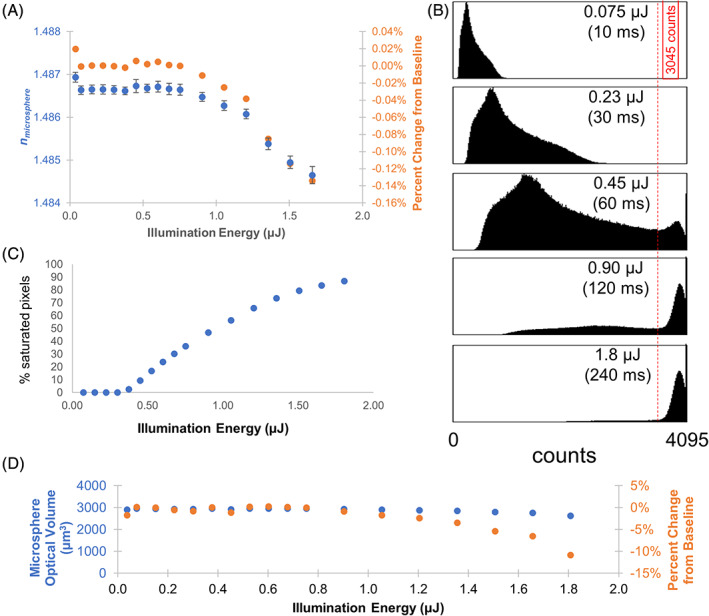
FIGURE 3.

Evaluation of the measured Δn and microsphere optical volume in response to illumination energy. The sample illumination energy produced by a LED illumination source centered at 590 nm was varied by changing the detector exposure time. The measured illumination power at the specimen plane was 7.5 μW over an area of 3.86 mm2. (A) Plot of the mean Δn for 66 beads versus the illumination energy. Error bars represent standard error of the mean. (B) Histogram of the CCD intensities (counts) for five different light exposure levels. Pixel saturation is indicated by the accumulation of pixel counts above the red vertical line. (C) A threshold at 3545 counts (red vertical line) was selected to quantify the number of saturated pixels. The mean on deviates from the baseline value when approximately 50% of the pixels are saturated. (D) Percent error of refractive index and optical volume were calculated with respect to the optimal illumination energy of 0.8 μJ and average microsphere diameter of 67.7 μm [Color figure can be viewed at wileyonlinelibrary.com]
