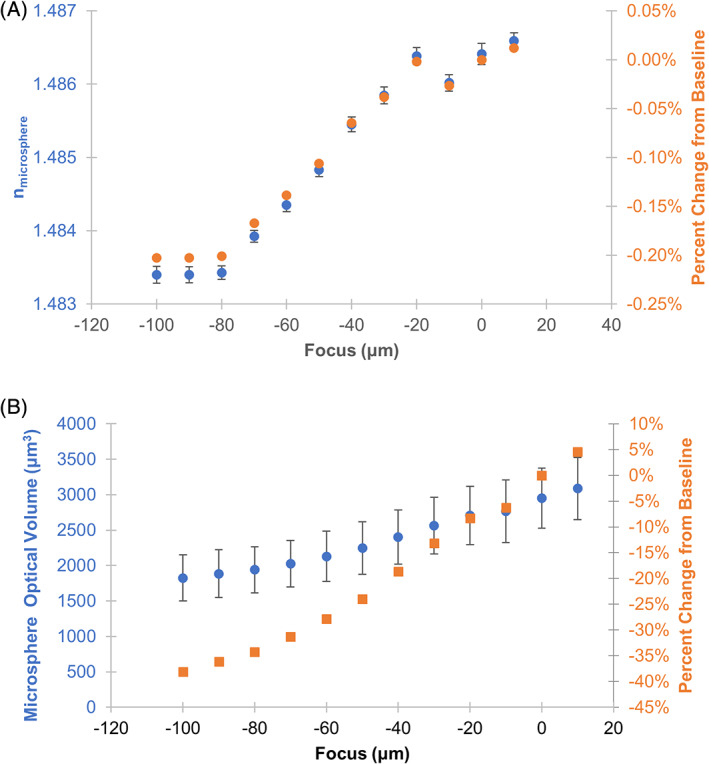
FIGURE 4.

Evaluation of quantitative QPI results in response to varying image focus. (A) Plot of the estimated index of refraction of the PMMA microsphere material versus sample focus. (B) Plot of the estimated microsphere optical volume versus sample focus. The in‐focus image plane was determined by inspection and labeled 0 μm focus. Microsphere phase image reconstruction was not possible for focus values above 10 μm. Error bars represent the standard error of the mean across 66 microspheres. Percent error of refractive index and optical volume were calculated with respect to in focus plane at 0 μm and average microsphere diameter of 67.7 μm [Color figure can be viewed at wileyonlinelibrary.com]
