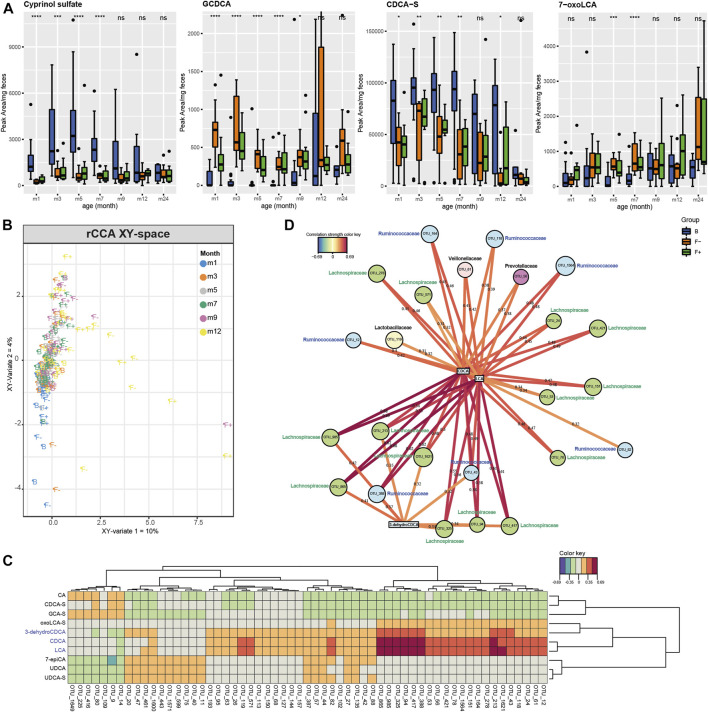
FIGURE 4.
(A) Individual boxplots of four bile acids, altered between B, F−, and F+ group in each month. Peak areas exceeding 5*mean for individual bile acids were excluded from plotting procedure for a better visualization. Significance was calculated in each month between B, F−, and F+ group using the Kruskal-Wallis rank sum test. ns: p > 0.05, *p ≤ 0.05, **p ≤ 0.01, ***p ≤ 0.001, ****p ≤ 0.0001. Regularized canonical correlation analysis (rCCA) was used to investigate the correlation between two datasets including LC-MS peak area-based bile acid data (X) and OTU data from 16S rRNA sequencing (Y). (B) XY-sample plot is colored according the months and labeled according to the feeding type. (C) Clustered image map of the cross-correlation matrix revealed a distinct cluster of positively correlating OTUs with LCA, CDCA, and 3-dehydroCDCA. (D) Corresponding relevance networks for correlations between the two datasets (XY). OTUs are represented by round and metabolites by rectangular nodes. Edges are correlation values, derived from rCCA. Correlation strength > ± 0.3 represented by edges was found for LCA, CDCA, and 3-dehydroCDCA. Solely positive correlations were found within these limits. Most of the correlating OTUs belong to the families Lachnospiraceae (green nodes) and Ruminococcaceae (blue nodes), both of them belong to the class of Clostridia.

