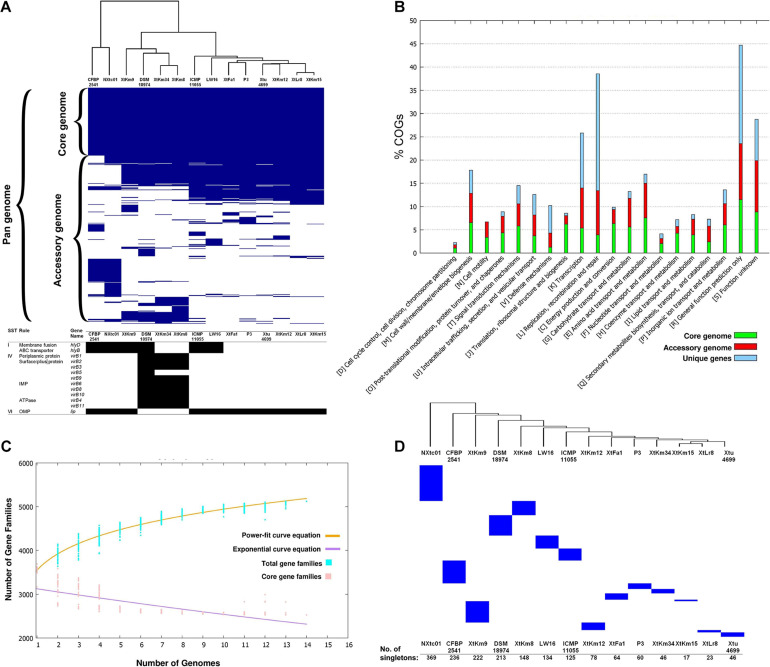
FIGURE 2.
Core- vs. pan-genome analyses of 14 Xanthomonas translucens strains using different criteria. (A) Ratio and size plot of core- and pan-genome generated using Roary 3.8.0 and visualized with Phandango. Each column corresponds to one strain while each row represents an orthologous gene family. The black and white table at the bottom of core- vs. pan-genome heat map created using KofamKOALA where black and white squares indicate presence and absence of a certain gene, respectively. (B) COG distribution of core, accessory and unique genes in the 14 X. translucens strains obtained using BPGA v. 1.3. (C) Total number of distinct gene families referring to the pan-genome of X. translucens strains illustrated by BPGA v. 1.3. (D) The number of singletons in each of the 14 X. translucens strains obtained using Roary 3.8.0.

