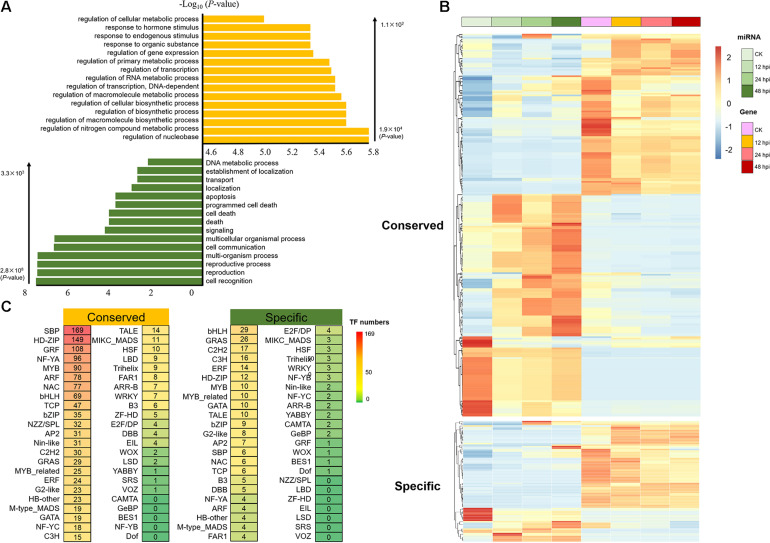
FIGURE 3.
Analysis of the target of conserved and Populus-specific miRNAs. (A) Significantly enriched Gene Ontology biological processes for target genes of conserved and Populus-specific miRNAs, respectively (Top 15; P < 1 × 10– 2). (B) Expression of the miRNA/target genes with negatively correlated expression patterns (r < –9 × 10– 1, P < 5 × 10– 2; Pearson correlation). (C) The number of transcription factor (TF) targets of conserved and Populus-specific miRNAs, respectively.

