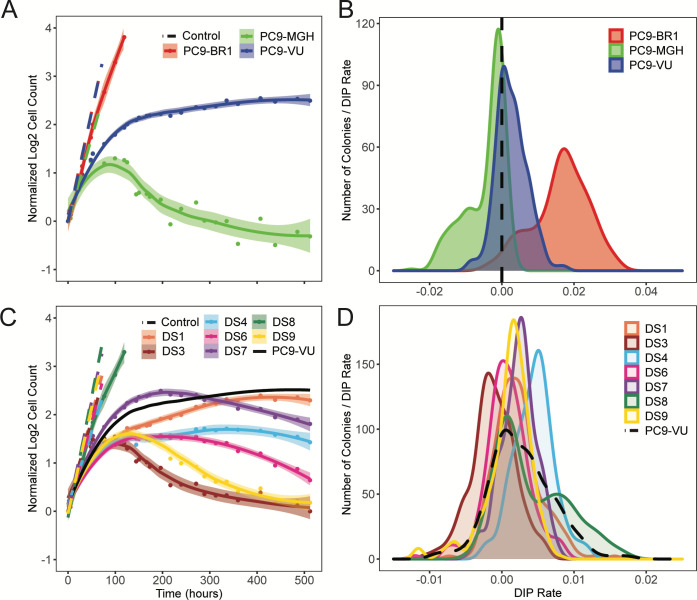
Fig 2. Phenotypic differences among PC9 cell line versions and discrete sublines quantified in terms of drug response.
(A) Population growth curves for 3 cell line versions treated with 3 μM erlotinib for approximately 3 weeks, plus vehicle (DMSO) control. (B) DIP rate distributions compiled from single-colony growth trajectories under erlotinib treatment (3 μM) in a cFP assay. DIP rates are calculated from the growth curves 48 h postdrug addition to the end of the experiment. Dashed black lines signify zero DIP rate, for visual orientation. (C) Seven DS derived from PC9-VU were treated with 3 μM erlotinib for 3 weeks, along with vehicle control. Parental PC9-VU is included for reference. (D) DIP rate distributions from a cFP assay of the sublines in 3 μM erlotinib. Parental PC9-VU is included for reference. In A and C, dots are the means of 6 experimental replicates at each time point; solid lines are best fits to the drug response trajectories with point-wise 95% confidence intervals. In B and D, DIP rate distributions are plotted as kernel density estimates. The data underlying this figure can be found in github.com/QuLab-VU/GES_2021. cFP, clonal fractional proliferation; DIP, drug-induced proliferation; DS, discrete subline.

