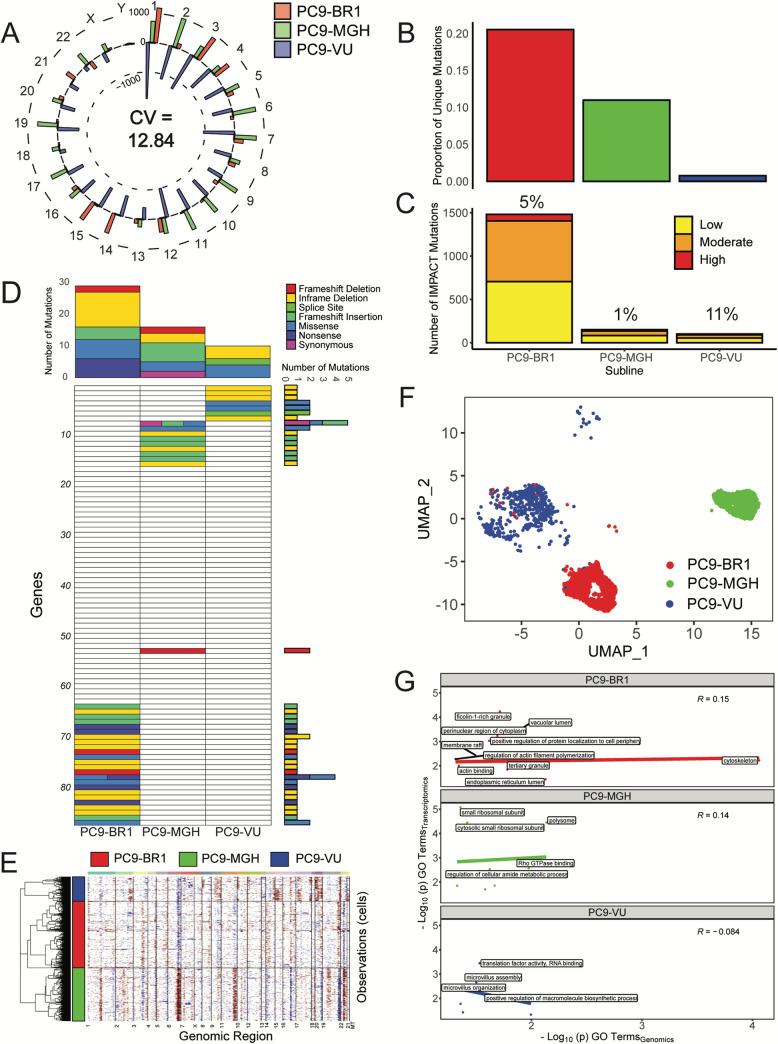
Fig 3. Genomic and transcriptomic characterizations of PC9 cell line versions.
(A) Mean-centered mutation count by chromosome for all cell line versions. For each chromosome, versions with fewer mutations than the mean have a bar pointing inwards, while those with more mutations than the mean point outwards. Chromosome numbers are noted on the outside edge of the circle. Average CV across all chromosomes is noted. (B) Proportions of unique mutations for all cell line versions. (C) Numbers of IMPACT mutations unique to each cell line version, stratified by IMPACT classification (“low,” “moderate,” and “high”). Percentage of unique IMPACT mutations relative to the total number of unique mutations for each cell line version is denoted above each bar. (D) Quantification of mutational differences between cell line versions based on a signature of genes with a high nonsynonymous mutational load. Rows are ordered the same as in Fig 4D and numbered in increments of 10 for ease of reference (see Table B in S1 Text). Heatmap elements are colored based on type of mutation. Total numbers of mutations (stratified by mutation type) across genes and cell line versions are shown as bar plots to the right and above the heatmap, respectively. (E) Copy number variant detection for cell line versions. Red corresponds to amplifications, blue to deletions. The average signal across all cells in the cell line versions was used to define the baseline reference. (F) UMAP visualization of single-cell transcriptomes for cell line versions. For comparison purposes, the UMAP space is defined over all 8 PC9 samples (including cell line versions and PC9-VU sublines; see Materials and methods). (G) GO comparison analysis of unique IMPACT mutations and DEGs for cell line versions. A correlation coefficient (Pearson) was calculated for each sample. Terms with -log10(p) > 2 on either axis are displayed on the plots. The data underlying this figure can be found in github.com/QuLab-VU/GES_2021. CV, coefficient of variation; DEG, differentially expressed gene; GO, Gene Ontology; UMAP, Uniform Manifold Approximation and Projection.

