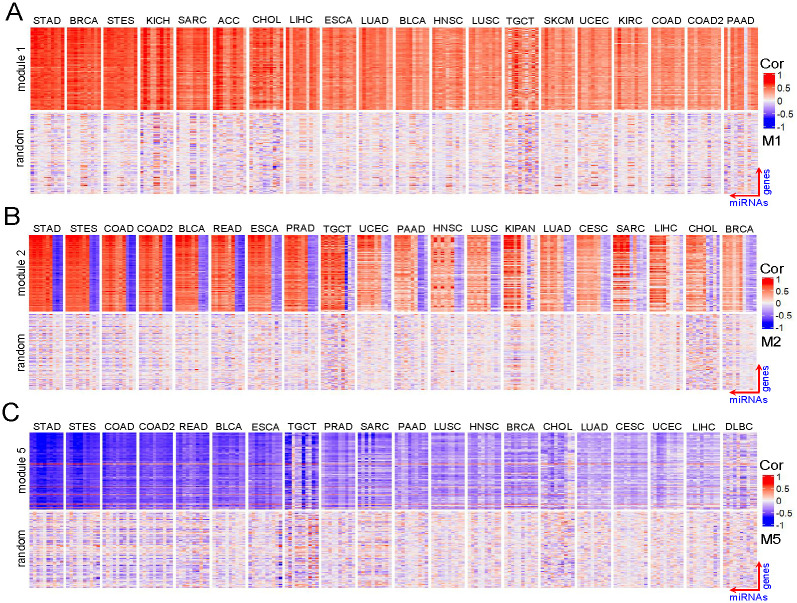
Fig 3. Heatmap of cancer-miRNA-gene modules identified by TSCCA in the TCGA dataset.
The top half of (A) corresponds to the module 1 (row corresponds to gene, column corresponds to miRNA) and the lower part of (A) is a random module for comparison. Similar setting is used for module 2 and module 5 in (B) and (C) respectively. (A), (B) and (C) show three different co-expression patterns.

