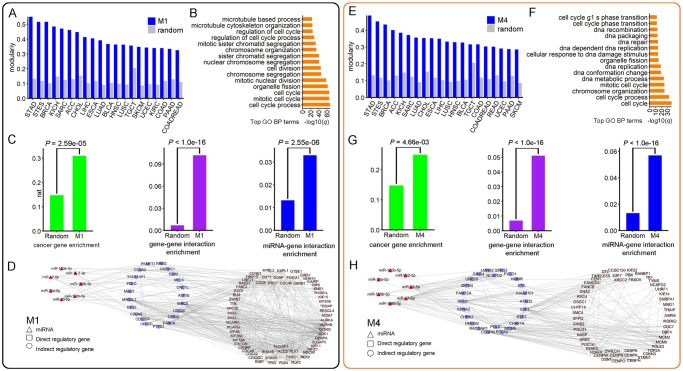
Fig 5. Illustration of two cancer-miRNA-gene modules identified by TSCCA in the TCGA dataset.
The results on module 1 are shown in (A), (B), (C) and (D), while the results on module 4 are shown in (E), (F), (G) and (H). (A) Bar plot showing modularity scores of module 1 and a random one for different cancer types. (B) Top enriched GO BP terms on the genes within module 1. (C) Cancer gene enrichment, gene-gene interaction enrichment and miRNA-gene interaction enrichment of module 1 and the corresponding P-values were computed using the right-tailed hypergeometric test. (D) Largest connected miRNA-gene subnetwork of module 1 (including 7 miRNAs and 84 genes and 538 edges), where the miRNAs directly regulate 21 genes and the 21 genes regulate 63 other genes. Similar setting was used for module 4 in (E), (F), (G) and (H). (H) Largest connected miRNA-gene subnetwork of module 4 (including 7 miRNAs and 75 genes and 309 edges), where the miRNAs directly regulate 24 genes and the 24 genes regulate 51 other genes.

