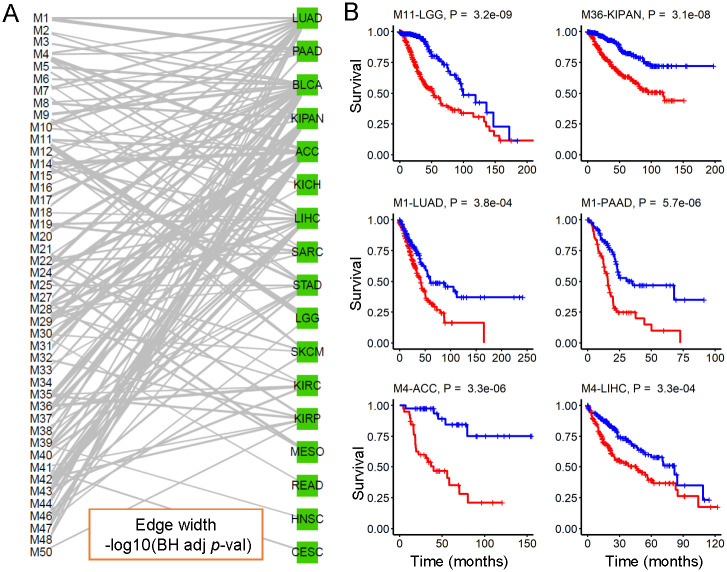
Fig 7. Survival analysis of modules.
(A) showing a bipartite graph between the identified modules and the different cancer types based on these -log10(BH adjusted P-value). For each identified module and each cancer within the module, we first extracted the first principal component (PC1) based on the expressed matrix of both miRNAs and genes within the module from the cancer type. We then divided the samples from the cancer type into two groups based on the median value of PC1 and a P-value was compute using log-rank test. In the graph, we only kept these edges/relationships between the modules and cancer types with adjusted P < 0.05. (B) Some cancer-miRNA-gene modules relate to survival time. For a given cancer type and a given module, the Kaplan-Meier survival curves were drawn for each group, and “+” denotes the censoring patient. Each sub-figure corresponds to a module and a cancer type. For example, Module 11 has a significant P = 3.2e-09 for LGG (cancer type), written as “M11-LGG, P = 3.2e-09”.

