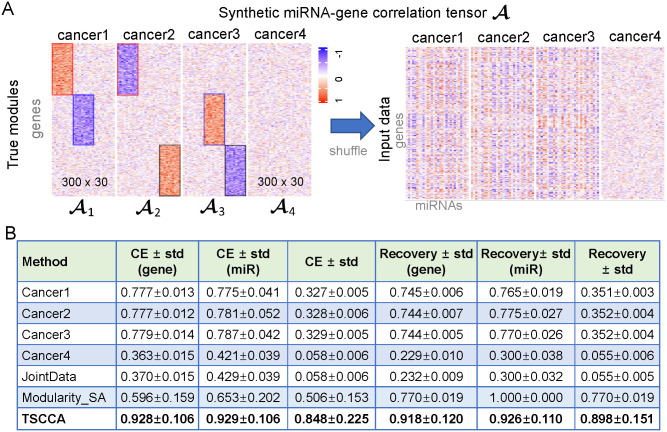
Fig 8. Comparison of results from different algorithms on the simulated data and TCGA data.
(A) A synthetic miRNA-gene correlation tensor , which contains four matrices with the same number of genes (rows) and miRNAs (columns), and includes three true modules framed by rectangular boxes of different colors. The shuffled is as the input of tested methods by shuffling the genes (rows) and miRNAs (columns) of . (B) Comparison of different methods in terms of CE ± std and Recovery ± std on the simulated data. The Recovery and CE scores are computed based on generated repeatedly.

