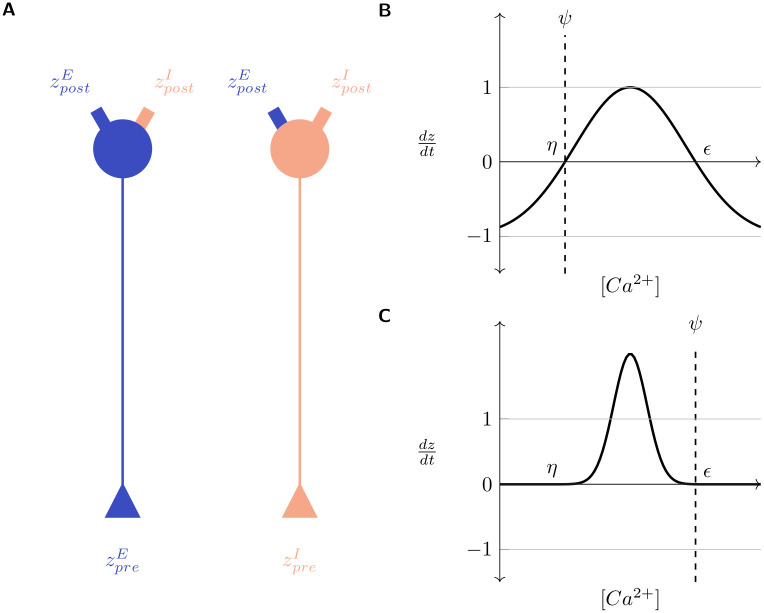
Fig 2. Gaussian growth curves modulate the rate of turnover of synaptic elements () in a neuron as a function of its [Ca2+].
(A) Excitatory: Blue; Inhibitory: Red; All neurons possess excitatory and inhibitory post-synaptic elements () but excitatory and inhibitory neurons can only bear excitatory and inhibitory pre-synaptic elements, respectively (); (B) and (C). Example Gaussian growth curves. Constants η and ϵ control the width and positioning of the growth curve on the x-axis. ω (see Eq 1) controls the positioning of the growth curve on the y-axis. ν (see Eq 1) is a scaling factor. ψ is the optimal [Ca2+] for the neuron. The minimum and maximum values of dz/dt can be analytically deduced to be −νω and ν(2 − ω) respectively (see Methods). The relationship between η, ϵ, and ψ regulates the activity dependent dynamics of neurites. (B) ψ = η = 5.0, ϵ = 15.0, ν = 1.0, ν = 1.0, −νω = −1.0, ν(2 − ω) = 1.0 (see Methods). Here, new neurites are formed when the neuronal activity exceeds the required level and removed when it falls below it. (C) η = 5.0, ψ = ϵ = 15.0, ν = 1.0, ω = 0.001, −νω = −0.001, ν(2 − ω) = 1.999 (see Methods). Here, the growth curve is shifted up along the y-axis by decreasing the value of ω. New neurites are formed when the neuronal activity is less than the homeostatic level and removed (at a very low rate) when it exceeds it.

