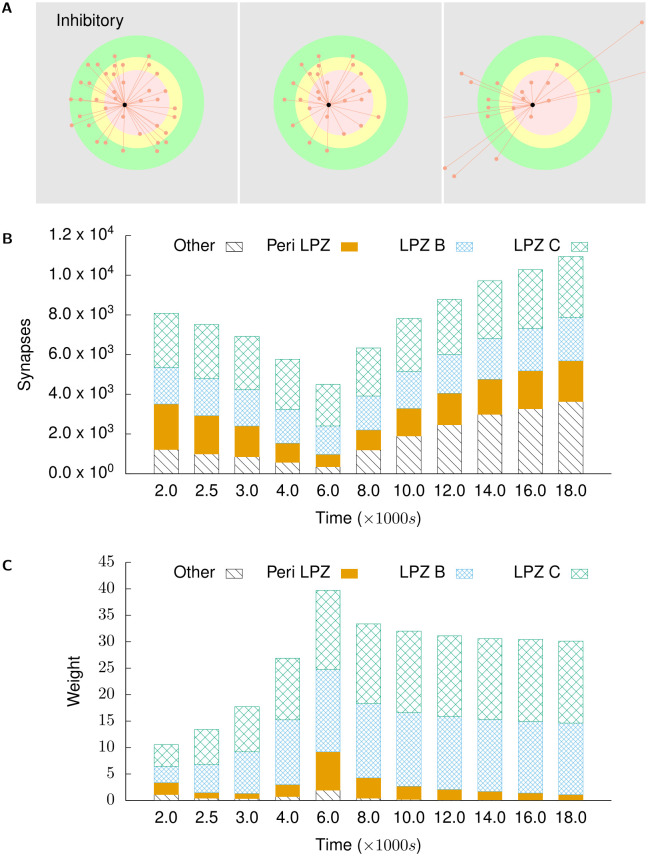
Fig 7. Inhibitory projections to excitatory neurons in the centre of the LPZ.
(A) shows incoming inhibitory projections to a randomly chosen neuron in the centre of the LPZ at different stages of our simulations. From left to right: t = 2000 s, t = 4000 s, and t = 18,000 s. (B) shows the total numbers of incoming inhibitory projections to neurons in the centre of the LPZ from different regions at different points in time. (C) shows the mean weight of projections received by neurons in the centre of the LPZ from different regions at different points in time. Also in line with biological observations, they temporarily experience dis-inhibition after deafferentation. However, as these neurons gain activity from their new lateral excitatory inputs, the number of their inhibitory input connections increases again in order to restore the E-I balance.

