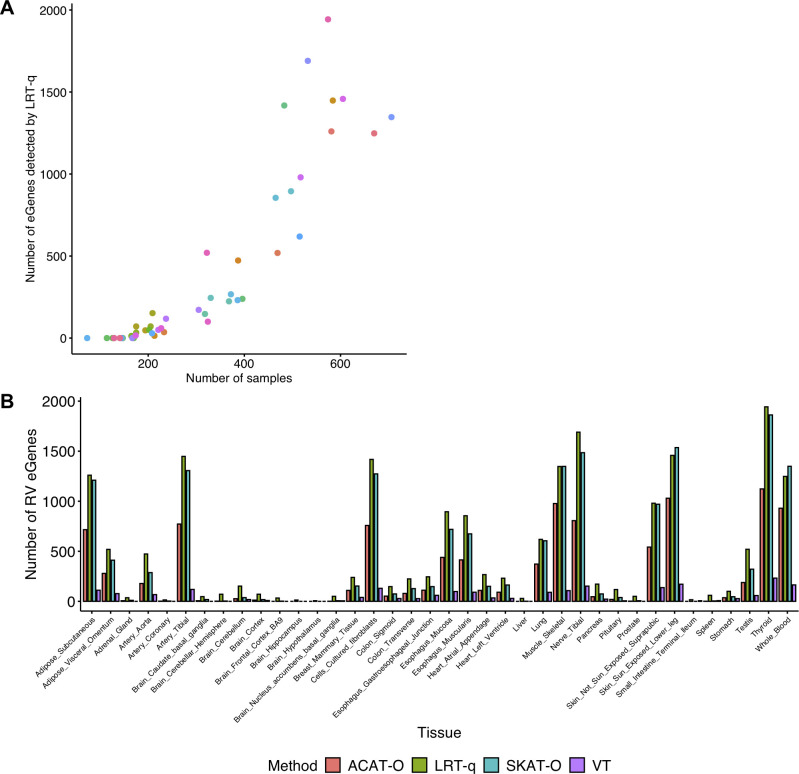
Fig 2. RV eGenes detected from 49 tissues in the GTEx v8 dataset.
A. The relationship between the number of total RV eGenes detected by LRT-q in each tissue and the sample size of each tissue. The colors of the data points are randomly assigned. Each tissue has its own color. B. The number of total RV eGenes detected by each method. In panel B, only tissues with more than one RV eGene detected by any methods are included.

