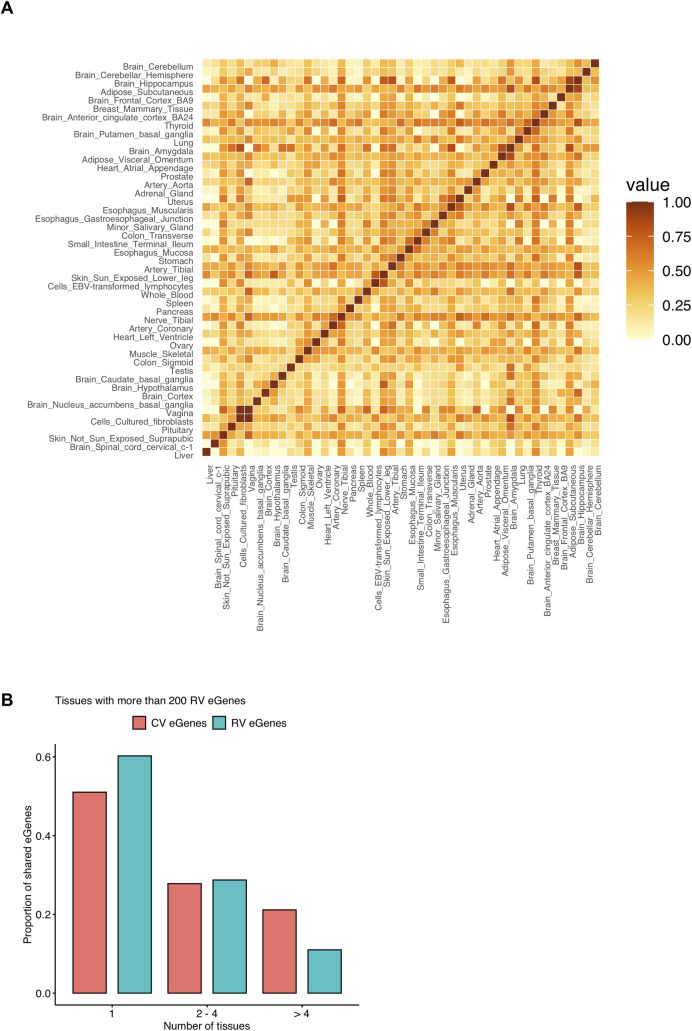
Fig 3. Tissue-sharing patterns of RV eGenes in the GTEx v8 dataset.
A. Pairwise tissue-sharing matrix of RV eGenes. It shows the fraction of shared RV eGenes in each pair of tissues. Here we use FDR < 10% to increase the number of RV eGenes. Tissues are sorted by clustering. Only tissues with more than one RV eGenes are included. B. The proportion of RV eGenes and CV eGenes shared among different numbers of tissues. Only tissues with more than 200 RV eGenes are selected. It shows the proportion of eGenes that are only detected in one tissue, in 2–4 tissues, and in more than 4 tissues.

