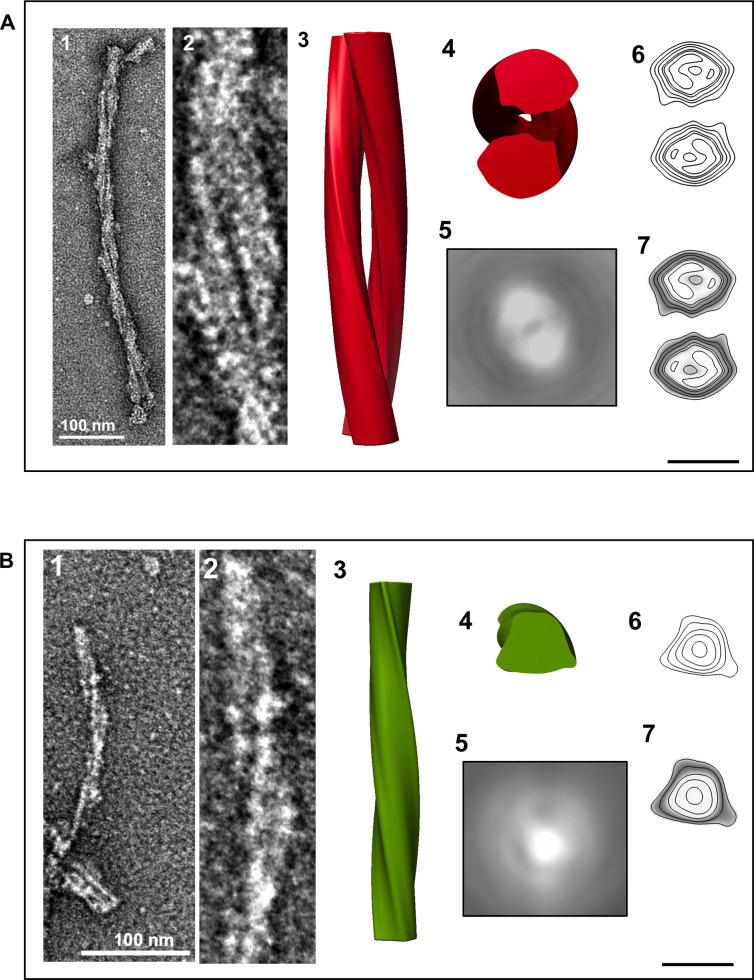
Fig 7. Three-dimensional reconstructions of L-type BSE prion fibrils.
(A) A 3D reconstruction of a two-protofilament fibril. (1) A negatively stained electron micrograph of a L-type BSE fibril, and (2) magnified view of the selected fibril section used for generating the 3D reconstruction. (3) A surface view of the 3D reconstruction showing two intertwined helical protofilaments. (4) Cross-section of the reconstruction. (5) The corresponding 2D projection of the averaged view of the cross-section region. (6) A contour map of the cross-section. (7) A contour density plot of the cross-section obtained by superimposition of the contour map onto a cross-section from the 3D volume. (B) A 3D reconstruction of a one-protofilament fibril. (1) A negatively stained electron micrograph of a L-type BSE fibril, and (2) enlarged view of the selected fibril. (3) Surface view of the 3D reconstruction. (4) Cross-section of the reconstruction. (5) The corresponding 2D projection of the averaged view of the cross-section region. (6) A contour map of the cross-section. (7) A contour density plot of the cross-section. The 3D reconstructions were low-pass filtered to 20 Å resolution. Scale bar = 10 nm.

