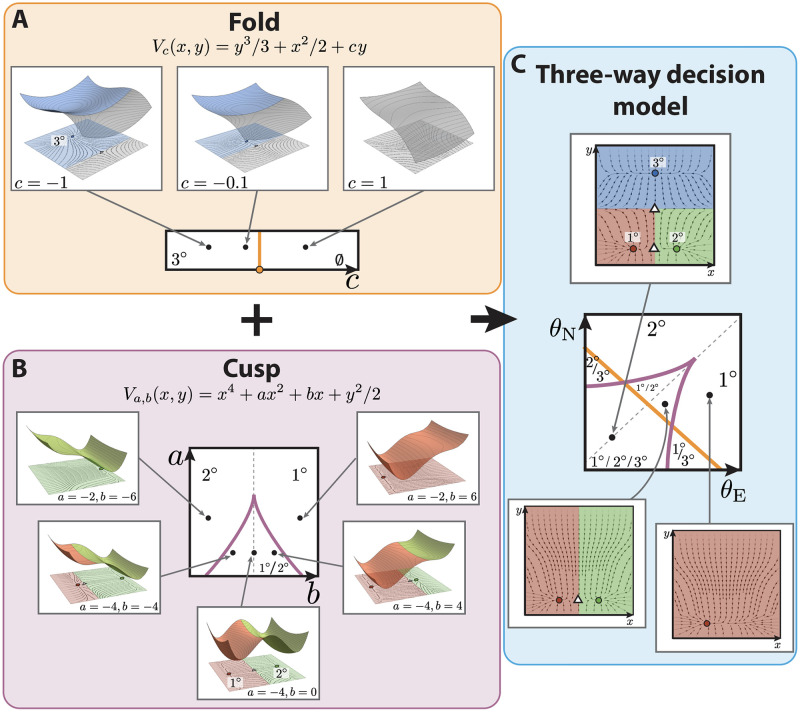
Fig 2. Binary flip with cusp model of vulval development in C. elegans.
(A) The fold catastrophe, controlled by the parameter c, defines the stability of the attractor representing 3° fate. The fate map is represented at the bottom, showing that the fold has a bifurcation at c = 0 (in orange), separating two stability regions: one containing 3° fate (for c < 0) and one where the fate disappears (c > 0). At the top, from left to right, different examples of landscapes for different values of c. For c < 0, the potential has two critical points in the state space: a minimum (blue circle) and a maximum (white triangle), such as the one represented on the top panels. Close to the bifurcation point, c = 0, the two critical points get near each other to merge together. For values of c > 0, the potential does not contain any critical point. (B) The cusp catastrophe, controlled by the parameters a, b, defines the stability of the attractors representing 1° and 2° fates. The fate map, at the center, shows that the cusp has a bifurcation set determined by Δ = 8a3 + 27b2 = 0 (purple cusp), separating three stability regions: one containing 1° and 2° fate (for Δ < 0) and two where only one of the two fates is present (Δ > 0). Examples of landscapes determined by different values of a, b are shown; in each case, 1° and 2° are represented by red and green circles, respectively, and the saddle between them is represented by a white triangle. On the cusp mid-line (gray dotted line in the fate map) the two fates are equally probable. Getting closer to the cusp favors one fate over the other, by the saddle approaching one of the attractors. Outside the cusp, the landscape only has one attractor, either 1° or 2°. (C) The two catastrophes are combined to generate a 2-dimensional flow with two saddles (white triangles) and three attractors representing each fate (blue, green and red circles represent 3°, 2° and 1° fates, respectively). By mapping the signals θE, θN onto the control parameters a, b, c, a fate map is obtained, defining the available fates in the landscape for different signaling profiles. The presence of 3° fate is controlled by the fold line, as shown in (A), and the stability of the 1° and 2° fates is controlled by the position of the signaling profile with respect to the cusp line, as shown in (B).

