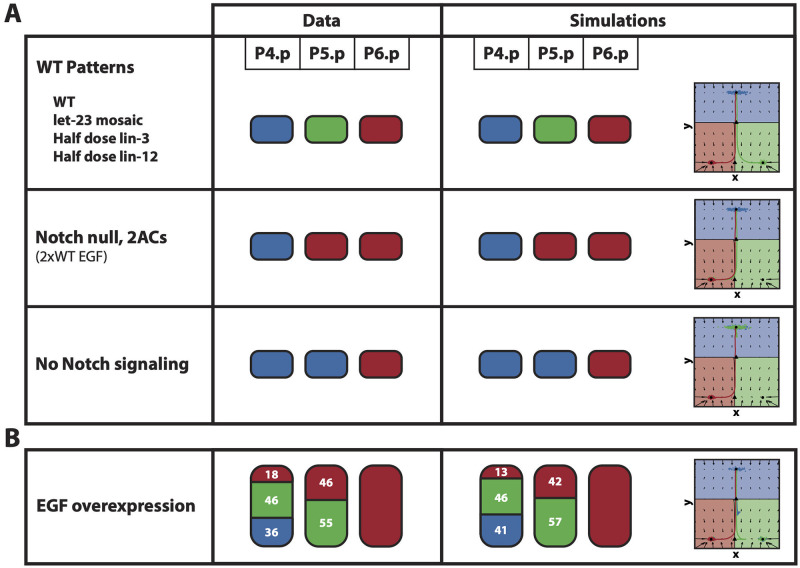
Fig 4. Fitting of the training data.
(A) The patterns of the 6 fully penetrant phenotype perturbations considered in the training data set are correctly fitted by the binary flip with cusp model. (B) The pattern of the partially penetrant phenotype given by the EGF overexpression perturbation considered in the training data set is also correctly fitted by the model. On the left, the experimental patterns. On the right, the mean simulated patterns and trajectories on the landscape. In both the experimental and simulated patterns, primary, secondary and tertiary fates are represented by the red, green and blue colors, respectively, and proportions higher than 90% have been rounded. On the landscape, the mean simulated trajectories for the particle with best overall approximation for P4.p, P5.p and P6.p are colored in blue, green and red, respectively.

