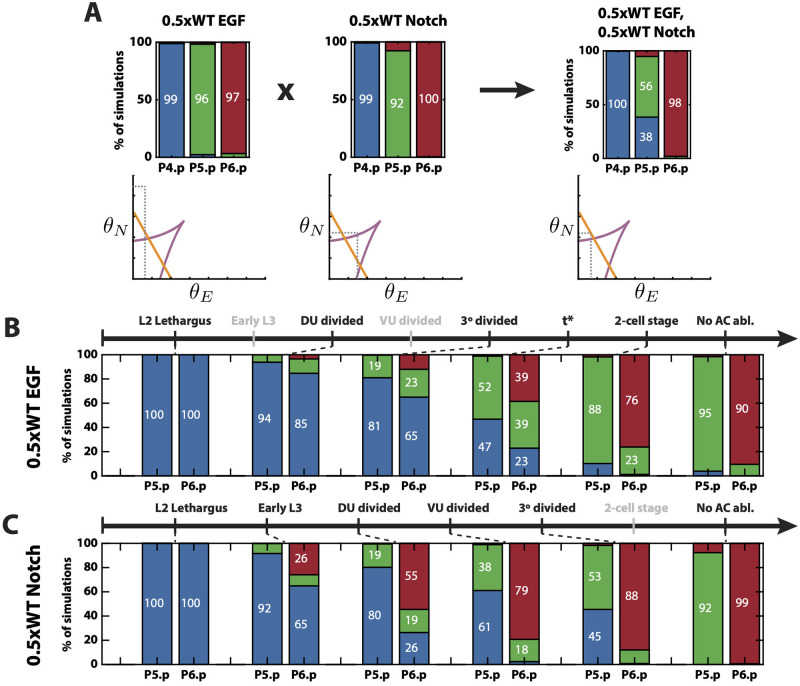
Fig 7. Model’s predictions.
(A) Predicted epistasis under the cross of reduced EGF ligand and Notch receptors perturbations. Top: Simulated proportions under the corresponding signaling profiles. Bottom: Schematics of the simulated positions of P5.p in the signal space under the different signaling profiles. (B) Predicted pattern proportions for different AC ablation times under a reduced EGF ligand perturbation. t* is a predicted time between 3° divided and 2-cell stages. The stages for which simulations are not shown are colored in gray. (C) Predicted pattern proportions for different AC ablation times under a reduced Notch receptors perturbation. The names of the stages for which simulations are not shown are colored in gray.

