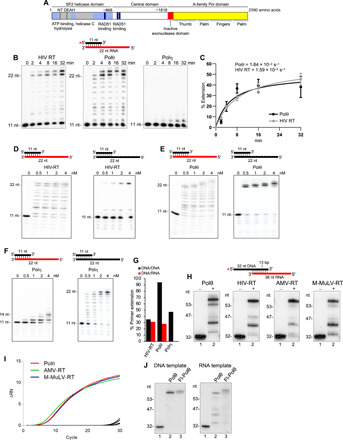
Fig. 1. Polθ exhibits reverse transcriptase activity.

(A) Schematic of full-length Polθ. (B) Denaturing gels showing a time course of DNA/RNA primer-template extension by the indicated polymerases. (C) Plot showing relative rate of DNA/RNA extension by Polθ and HIV RT. Data represent mean ± SD; n = 3. (D to F) Denaturing gels showing DNA/RNA (left) and DNA/DNA (right) extension by the indicated polymerases. (G) Bar plot showing percent extension of DNA/RNA (red) and DNA/DNA (black) by the indicated polymerases (4 nM) [data from (D) to (F)]. (H) Denaturing gels showing DNA/RNA extension by the indicated polymerases. (I) Quantitative PCR chromatogram showing cDNA synthesis by the indicated polymerases. (J) Denaturing gels showing DNA/DNA (left) and DNA/RNA (right) extension by Polθ and Fl-Polθ.
