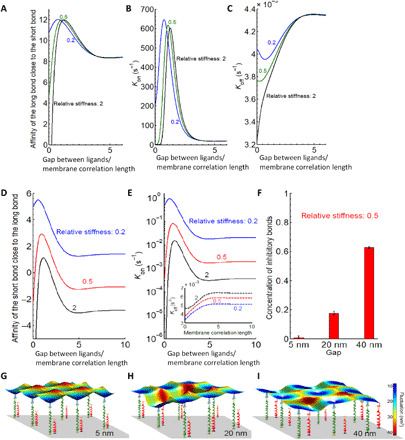
Fig. 4. Modeling the interaction of an NK cell with a substrate with immobilized ligands for KIR2DL1 and NKG2D.

(A to C) Affinity, binding, and unbinding reaction rates of the long bond close to the short bond as a function of the gap between ligands normalized to membrane correlation length. (D and E) Affinity and binding rates of the short bond as a function of a distance (normalized to the membrane correlation length which is about 100 nm) from the existent long bond. Inset in (E): Dissociation rate of the long bond in the presence of the short bond. (F) Concentration of total number of bonds for different gap sizes, showing a clear increase in their numbers when the gap is wider. The error bars signify the variance in the total number of bonds in equilibrium and are calculated from the concentration-time curve (taking equilibrium state). (G to I) Characteristic snapshots of a small segment between the membrane and the patterned substrate are shown for a gap of (G) 5 nm, (H) 20 nm, and (I) 40 nm.
