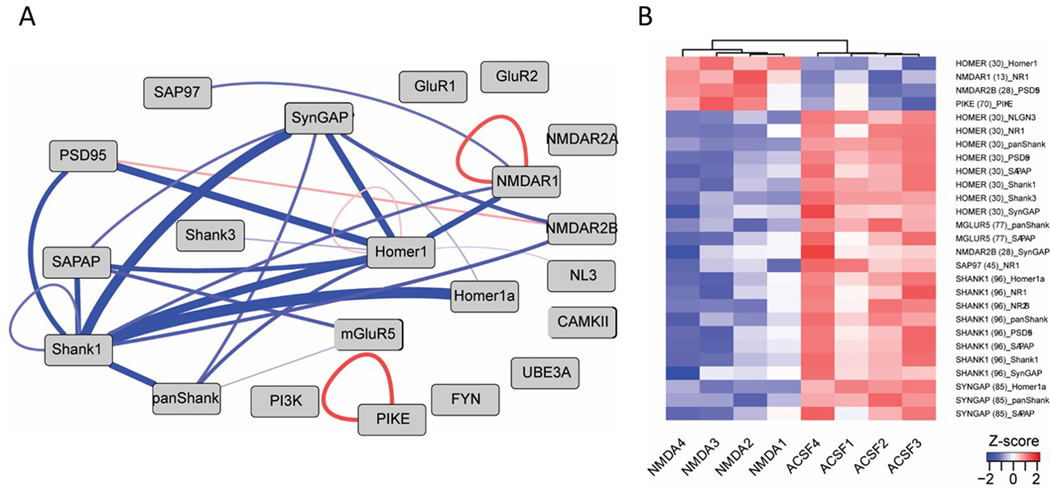
Figure 5. ANC U CNA hits in an NMDA stimulation experiment.
Visualizations of the results of a QMI experiment comparing NMDA stimulated neurons to aCSF (unstimulated) controls. Only protein-protein interactions that were statistically significant by both ANC and CNA data pipelines are shown in the node-edge diagram (a) made in Cytoscape and the heatmap (b) made in R.

