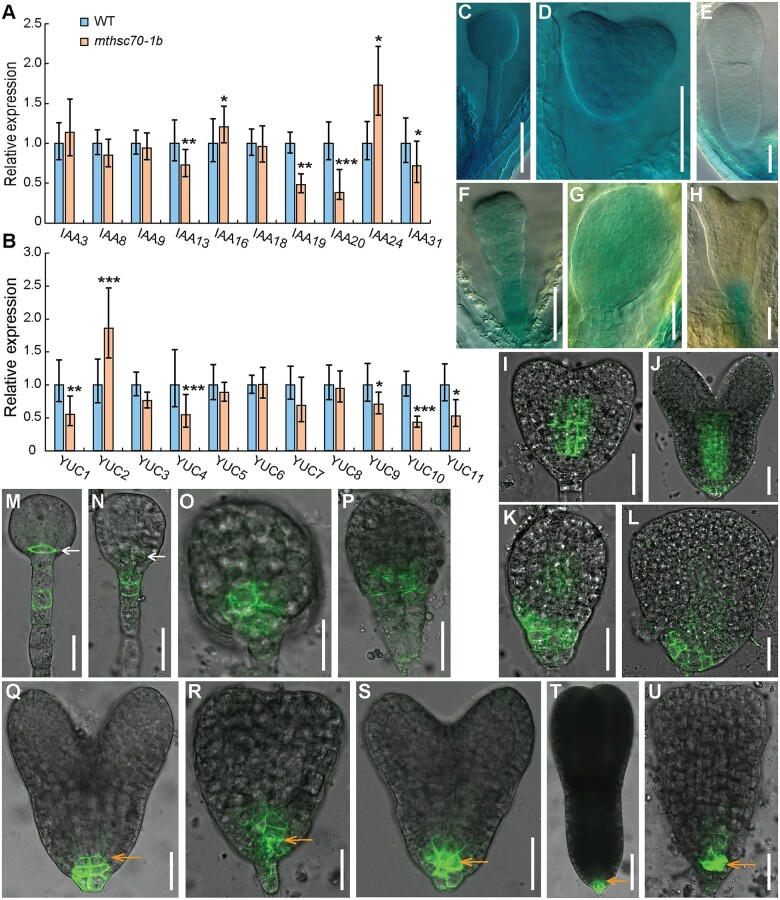
Figure 5.
Expression analyses of auxin-related genes in WT and mthsc70-1b siliques or embryos. A and B, Relative transcription levels of IAA (A) and YUCCA (YUC) (B) genes in 1–3-DPA siliques. The transcription levels were normalized to that of TAP42 INTERACTING PROTEIN OF 41 KDA (TIP41, AT4G34270). Values are means ± sd of three independent experiments. Significant differences were analyzed using Student’s t test (one-tailed, two-sample equal variance; *P < 0.05; **P < 0.01; and ***P < 0.001). C–H, Expression patterns of ProYUC9:GUS in WT (C–E) and mthsc70-1b (F–H) embryos at globular (C and F), heart (D and G), and torpedo (E and H) stages. Shown in (C–H) are representative images of three independent experiments (n = 100 embryos from 15 plants per experiment). I–L, AUX1-YFP localization in WT (I and J) and mthsc70-1b (K and L) embryos at early-heart (I and K) and late-heart (J and L) stages. M-U, PIN3-GFP localization in WT (M, Q, and T) and mthsc70-1b (N–P, R–S, and U) embryos at globular (M–P), heart (Q–S), and torpedo (T and U) stages. White arrows indicate the lens-shaped cell; orange arrows indicate the QC or putative QC cells. Shown are representative images of 38 embryos per genotype. Bars = 50 μm (C–H) and 25 μm (I–U).

