Figure 5.
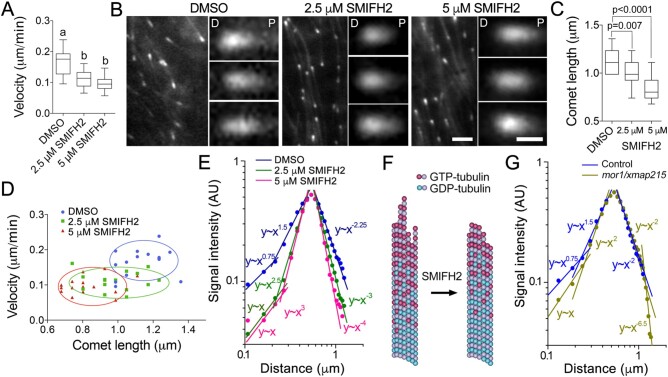
SMIFH2 inhibits microtubule polymerization and alters EB1 plus-end localization. A, Microtubule polymerization rates in interphase BY-2 cells treated with DMSO (mock) or SMIFH2. Cells were treated with SMIFH2 for 3 h in all experiments shown in this figure. B, Confocal microscopic images of mCherry-AtEB1b in interphase BY-2 cells. The distal or proximal comet ends are denoted by letter D and P respectively. Scale bar are 2 µm or 0.5 µm on zoomed images. C, Average mCherry-AtEB1b comet lengths in cells treated with DMSO, 2.5 or 5 µM SMIFH2. D, Relationships between microtubule polymerization rates and mCherry-AtEB1b comet lengths in cells treated with DMSO and SMIFH2. Each data point represents measurement of one comet. E, Impact of SMIFH2 on mCherry-AtEB1b comet shape. X-axis in E and G shows absolute distance from the distal to the proximal ends of the EB1 comet, y-axis shows normalized fluorescence signal intensity. F, A model of SMIFH2 activity. SMIFH2 reduces the length of tubulin protofilament “flares” and increases β-tubulin GTP hydrolysis rate resulting in less GTP-tubulin in the microtubule lattice to which EB1 binds. G, Analysis of ProEB1::EB1b-GFP comet shapes in Arabidopsis mor1-1 mutant dark-grown hypocotyl epidermis cells compared to wild-type. Whiskers in A and C denote minimal to maximal range of values. Statistically different average values are denoted by different letters as determined by one-way ANOVA test. P-value was calculated using unpaired t test (n = 15).

