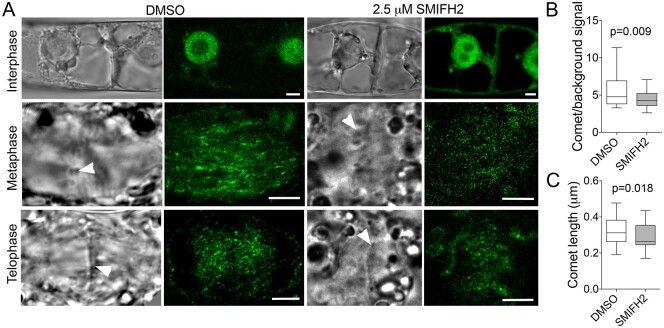
Figure 6.
Impact of SMIFH2 on AtEB1c-GFP comet size and intensity during cell division. A, Confocal microscopic images (right) showing SMIFH2 does not affect nuclear localization of AtEB1c-GFP in BY-2 cells during interphase, but results in less intensive labeling of comets during both metaphase and telophase. Scale bars, 5 µm. Arrowheads in bright-field images (left) denote position of chromosomes during metaphase and cell plate during telophase. B, The ratio of signal intensity of AtEB1c-GFP comets to the background signal in phragmoplasts of BY-2 cells treated with DMSO or 2.5 µM SMIFH2. P-value was calculated using unpaired t test (n = 31). Whiskers in B and C denote minimal to maximal range of values. C, Size of AtEB1c-GFP comets in the phragmoplasts of BY-2 cells treated with DMSO or 2.5 µM SMIFH2. P-value was calculated using unpaired t test (n = 31). Cells were treated with SMIFH2 for 3 h in all experiments.

