Figure 8.
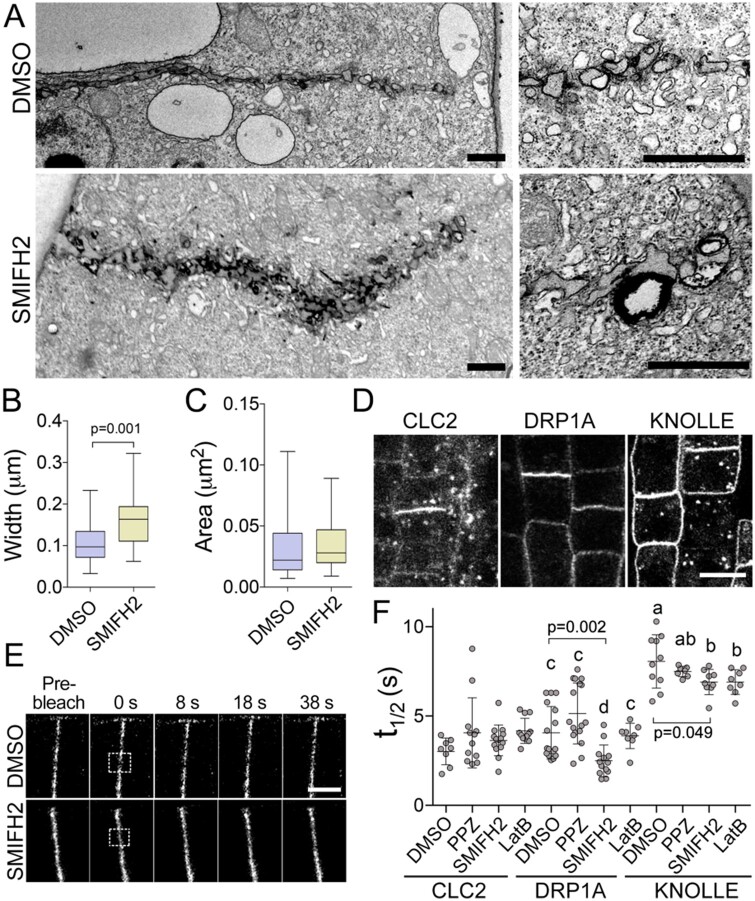
SMIFH2 inhibits cell plate membrane remodeling. A, Electron microscopic images of cell plate morphologies in BY-2 cells after treatment with 2.5 µM SMIFH2 for 3 h. Scale bar, 1 µm. B, Statistical analysis of cell plate morphology using electron micrographs. P-value was calculated using unpaired t test (n = 28). C, Area of the individual vesicles at the growing edge of the cell plate in BY-2 cells treated with DMSO or 2.5 µM SMIFH2 (n = 28). Whiskers denote minimal to maximal range of values. D, Confocal microscopy images showing CLC2-GFP, DRP1A-GFP, and KNOLLE-GFP localization to the cell plates of Arabidopsis root epidermal cells. Scale bar, 5 µm. E, Representative confocal time-lapse images of photobleaching experiments in Arabidopsis root apical meristem cells expressing DRP1A-GFP after treatment with DMSO or 25 µM SMIFH2. The photobleached areas are indicated by the rectangles. Scale bar, 5 µm. F, Turnover of CLC2-GFP, DRP1A-GFP, and KNOLLE-GFP in root epidermis cell after treatment with 0.5% (v/v) DMSO, 10 µM SMIFH2, 5 µM propyzamide (PPZ), or 5 µM latruncnulin B (LatB) for 6 h. Significantly different average values are denoted by different letters as determined by one-way ANOVA test.

