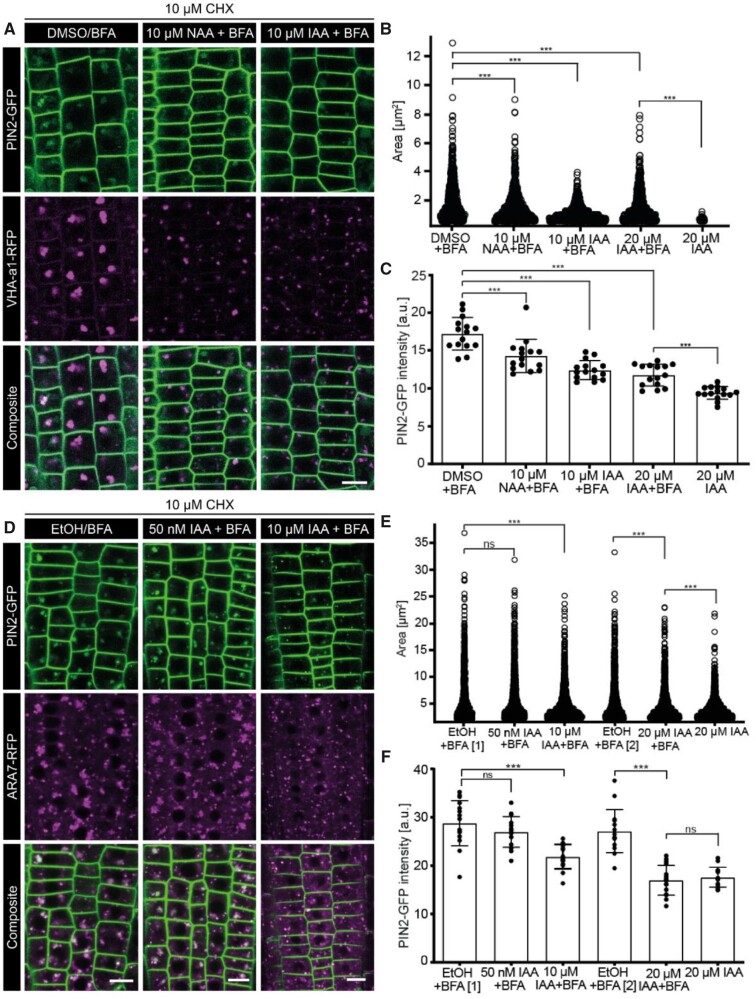
Figure 1.
Effect of NAA and IAA on the endosomal aggregation response to BFA. A, Confocal images of the root epidermis expressing VHA-a1-RFP and PIN2-GFP. Endosomal aggregation after 30 min pre-treatment with DMSO (mock), 10 μM IAA, 20 μM IAA, or 10 μM NAA, followed by 30 min co-treatment with 50 μM BFA. 20 μM IAA treatment is the internal control. Throughout the experiment, seedlings were treated with 10 μM CHX. B, Sina plot of the EE/TGN aggregation size in μm2. Each point is a measurement of an aggregate. N = 6 roots in each condition; all the epidermal cells in the imaging plane of the root tip were measured. One-sided Mann–Whitney U test (653, 898, 691, 842, and 50 measurements from each condition). DMSO+BFA (mock) > 10 µM NAA+BFA, P = 9.646e−09***; DMSO+BFA (mock) >20 µM IAA+BFA, P = 6.982e−09***; DMSO+BFA (mock) >10 µM IAA+BFA, P < 2.2e−16***; 20 μM IAA+BFA >20 µM IAA (control), P < 4.59e−16***. C, Scatter dot plots of PIN2 intracellular intensity. The error bars represent mean with sd. N = 5 roots in each condition; 15 cells per root. One-sided t test (with Welch’s correction). DMSO+BFA (mock) >10 μM NAA+BFA, ***P = 0.0010; DMSO+BFA (mock) >20 μM IAA+BFA, ***P < 0.0001; DMSO+BFA (mock) >10 μM IAA+BFA, ***P < 0.0001; 20 μM IAA+BFA >20 µM IAA (control), ***P < 0.0001. D, Confocal images of root epidermal cells expressing ARA7-RFP and PIN2-GFP. Endosomal aggregation after 30 min pre-treatment with ethanol (mock), 50 nM IAA, or 10 μM IAA followed by 30 min co-treatment with 50 μM BFA. 20 µM IAA treatment is the internal control. Throughout the experiment, seedlings were treated with 10 μM CHX. E, Sina plot of the LE aggregation size in μm2. Each point is a measurement of an aggregate. N ≥ 6 roots in each condition; all the epidermal cells in the imaging plane of the root tip were measured. EtOH+BFA [1] is the corresponding mock for 50 nM and 10 µM IAA and EtOH+BFA [2] corresponds to 20 µM IAA. One-sided Mann–Whitney U test (1,122, 1,552, 1,397, 1,048, 1,197, and 1,229 measurements from each condition). EtOH+BFA (mock) > 10 μM IAA+BFA, ***P = 3.789e−09; EtOH+BFA (mock) >20 μM IAA+BFA, ***P = 0.000241; EtOH+BFA (Mock) >50 nM IAA+BFA, P = 0.2; 20 μM IAA+BFA > 20 μM IAA (control), **P = 0.001. F, Scatter dot plots of PIN2 intracellular intensity. EtOH+BFA [1] is the corresponding mock for 50 nM and 10 µM IAA and EtOH+BFA [2] corresponds to 20 µM IAA. The error bars represent mean with sd. N ≥ 6 roots in each condition; 15 cells per root. One-sided t test (with Welch’s correction). EtOH+BFA (mock) >20 μM IAA+BFA, ***P < 0.0001; EtOH+BFA (mock) >10 μM IAA+BFA, ***P < 0.0001; EtOH+BFA (Mock) >50 nM IAA+BFA, P = 0.11; 20 μM IAA+BFA <20 μM IAA (control), P = 0.26. Scale bars: 10 μm.

