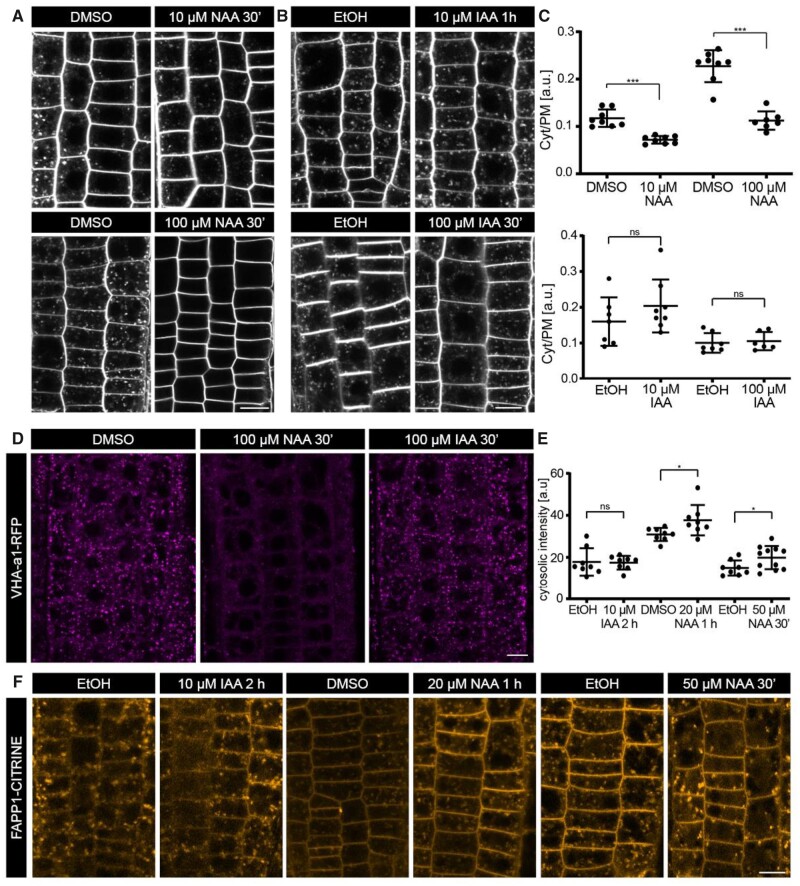
Figure 2.
Effects of NAA and IAA on the endomembrane system. A and B, Representative confocal images of FM4-64 internalization after treatment with NAA (A) or IAA (B) (10 µM or 100 µM for 30 min). C, Scatter dot plots of the amount of endosomal FM4-64 signal measured as the ratio between the mean cytosolic intensity to the mean PM intensity. The error bars represent mean with sd. 10 µM and 100 µM NAA: N ≥ 7 roots per condition; at least 10 cells per root. Two-sided t test. DMSO (mock) versus NAA (10 µM/100 µM), P < 0.0001***. 10 µM IAA: N ≥ 6 roots; at least seven cells per root. Two-sided t test. EtOH (mock) versus 10 μM IAA, P = 0.25. 100 µM IAA: N = 8 roots; at least 10 cells per root. Two-sided t test. EtOH (mock) versus 100 μM IAA, P = 0.74. D, Confocal images of EE/TGN at the root epidermis expressing VHA-a1-RFP after treatment with 100 μM NAA or 100 µM IAA for 30 min. E, Scatter dot plots of the intracellular FAPP1-CITRINE intensity. The error bars represent the mean with sd. N = 8 roots per condition; 8 cells per root. One-sided t test. EtOH 2 h (mock) <10 μM IAA 2 h, P = 0.445; DMSO 1 h (mock) <20 μM NAA 1 h, *P = 0.0183 (with Welch’s correction); EtOH 30′ (mock) <50 μM NAA 30′, *P = 0.02. F, Confocal images of the endomembrane system marked by FAPP1-CITRINE after mock, NAA, or IAA treatment. Scale bars: 10 μm.

