Figure 3.
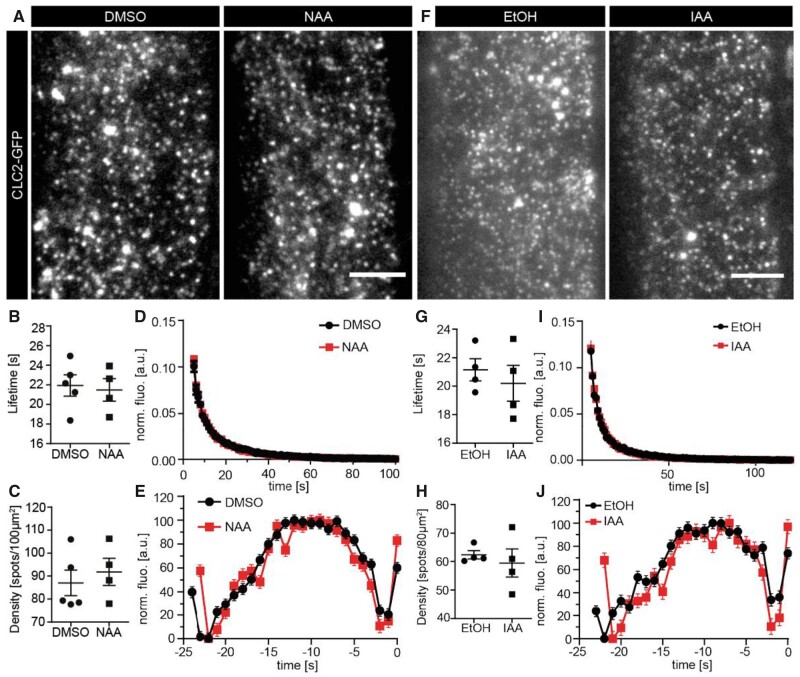
Effect of NAA and IAA on the CME machinery. A, Representative TIRF-M images of root epidermal cells expressing CLC2-GFP after treatment with DMSO (mock) or NAA (10 µM, 5–10 min). B, Mean lifetimes, (C) mean density, (D) normalized lifetime histogram, and (E) the fluorescence intensity profile of all tracks. All plots represent the mean ± se. N: DMSO = 5 cells from independent roots, 32,990 tracks; N: NAA = 4 cells from independent roots, 32,534 tracks. Two-sided t tests: mean lifetimes: P = 0.58; mean density: P = 0.78. F, Representative TIRF-M images of root epidermal cells expressing CLC2-GFP after treatment with DMSO (mock) or IAA (10 µM, 5–10 min). G, Mean lifetimes, (H) mean density, (I) normalized lifetime histogram, and (J) the fluorescence intensity profile of all tracks. All plots represent the mean ± se. N: DMSO = 4 cells from independent roots, 22,786 tracks; N: IAA = 4 cells from independent roots, 28,618 tracks. Two-sided t tests: mean lifetimes: P = 0.54; mean density: P = 0.6. Scale bars: 5 µm.

