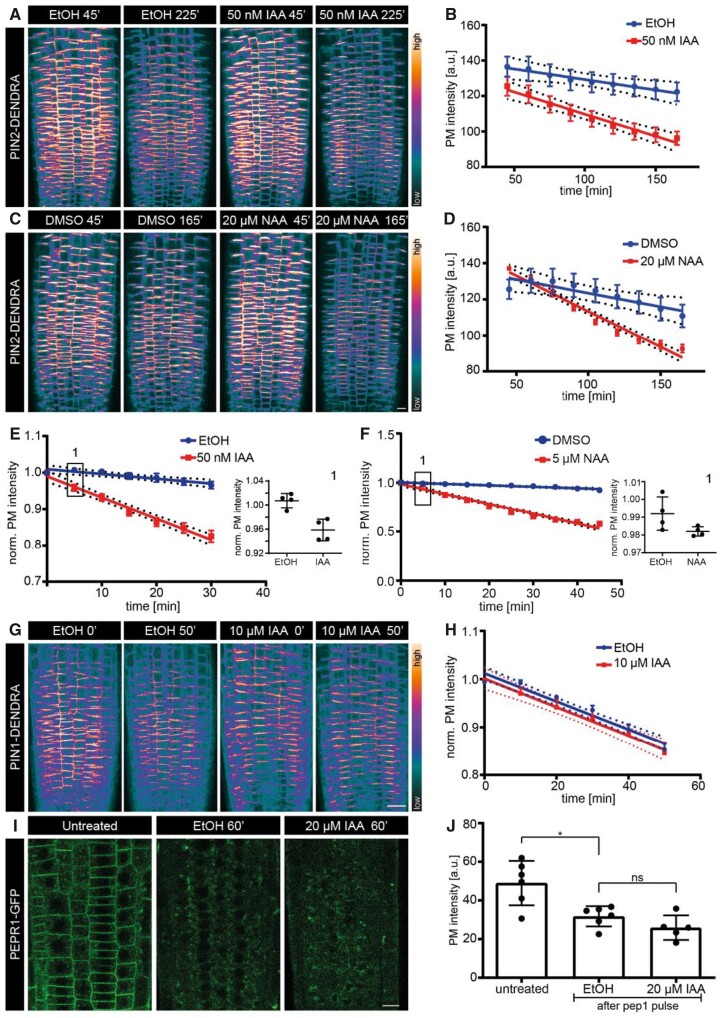
Figure 4.
Effect of NAA and IAA on the internalization of different cargoes. A and C, Representative confocal images of the root epidermis expressing PIN2-Dendra at two isolated time-points after treatments: EtOH (mock) or 50 nM IAA (A), DMSO (mock), or 20 µM NAA (C), and their corresponding intensity measurements over-time in (B) and (D). B, Regression analysis (mock versus 50 nM IAA). N ≥ 3 roots per condition; two independent experiments. χ2—56.897; df = 1; ***P = 4.594e−14. D, Regression analysis (mock versus 20 µM NAA). N = 4 roots per condition. χ2—62.216; df = 1; ***P = 3.078e−15. E, Regression analysis (mock versus 50 nM IAA). N = 4 roots per condition. χ2—69.418; df = 1; ***P = 2.2e−16. F, Regression analysis (mock versus 5 µM NAA). N = 4 roots per condition. χ2—75.878; df = 1; ***P = 2.2e−16. The scatter plot in the inset 1 (representing the first data point of graph F) shows intensity difference 5 min after IAA (E) or NAA (F) treatment. One-sided t test. EtOH (mock) >50 nM IAA, **P = 0.0021; DMSO (mock) >5 µM NAA, *P = 0.043. G, Representative confocal images of root epidermal cells expressing PIN1-Dendra at two isolated time-points after EtOH (mock) or 10 µM IAA treatments. H, Regression analysis (mock versus 10 µM IAA). N ≥ 5 roots per condition. χ2—0.65; df = 1; P = 0.42. All the regression analyses of the PIN PM intensity were performed by fitting a linear mixed model on the intensity values measured from all the cells in the imaging plane of the epidermis. Each dot represents the mean intensity and the dotted lines depict the 95% CI. LMER—random effects for position. I, Representative confocal images of root epidermal cells expressing PEPR1-GFP; before pep1 pulse (untreated—control); and after pep1 pulse and treatments with EtOH (mock) or 20 µM IAA for 1 h. J, Scatter dot plots of PM PEPR intensity. The error bars represent the mean with sd. N ≥ 5 roots per condition; 10 cells per root. Two-sided Mann–Whitney U test. EtOH versus 20 µM IAA, P = 0.24. One-sided Mann–Whitney U test. Untreated > EtOH, *P = 0.013. Scale bars: 10 µm.

