Figure 5.
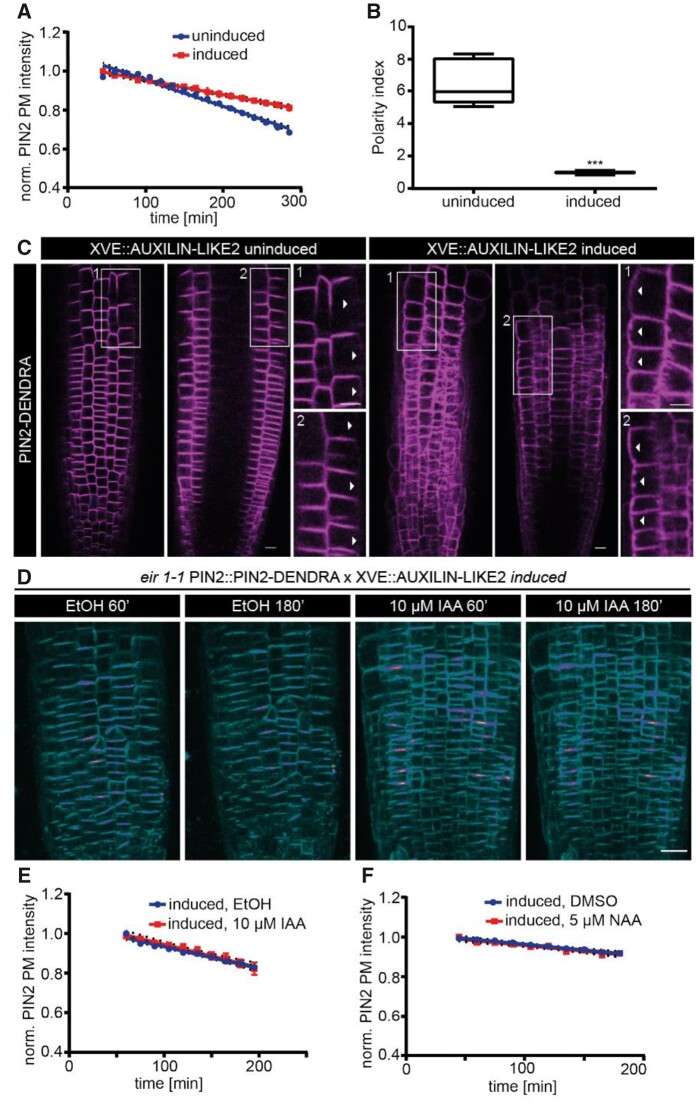
Auxin-mediated promotion of PIN2 internalization and its polarity are clathrin dependent. A, Regression analysis (uninduced versus induced). N = 4 roots per condition; χ2—65.82; df = 1; ***P = 4.931e−16. B, PIN2 polarity index in AXL2 uninduced versus induced conditions measured as the ratio of apical PIN2 intensity to lateral PIN2 intensity. N = 5 roots per condition; 10 cells per root; three independent experiments. Mann–Whitney U test, ***P < 0.0001. C, Representative confocal images of root epidermal cells expressing PIN2-Dendra; AXL2 uninduced (left) and induced (right) conditions. The inset 1 in each condition shows the front of the epidermis and the inset 2 shows the middle of the epidermis. White arrowheads indicate the lateral PIN2 distribution. D, Representative confocal images of root epidermal cells expressing PIN2-Dendra at two isolated time-points after EtOH (Mock) or 10 µM IAA treatments in AXL2-induced condition. E, Regression analysis (mock versus 10 µM IAA). N ≥ 5 roots per condition; LM; F = 0.88; P = 0.34. F, Regression analysis (mock versus 5 µM NAA). N = 5 roots per condition; LMER—random effects for position; χ2—0.0027; df = 1; P = 0.95. The regression analysis of the PIN2 PM intensity shown in plots A and F were performed by fitting a linear mixed model on the intensity values measured from all the epidermal cells in the imaging plane of the root tip. Each dot represents the mean intensity and the dotted lines depict the 95% CI. LMER—random effects for position. Scale bar: 20 µm.

