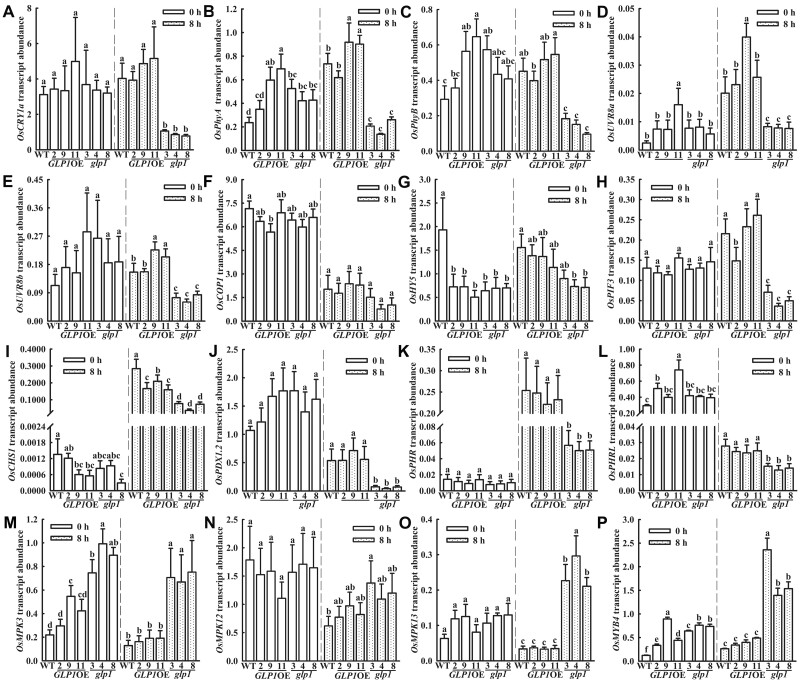
Figure 7.
RT-qPCR analysis of the expression of UV-B-associated genes regulated in glp1 compared to WT. WT, transgenic plants overexpressing OsGLP1 (2, 9, and 11) and glp1 mutants (3, 4, and 8) were grown in a growth chamber under 600 µmol m−2 s−1 constant white light (12-h light, 30°C; 12-h dark, 28°C) to the 4-leaf stage, then transferred to natural sunlight for 0 h (600 μmol m−2 s−1, 0 μW cm−2 UV-B, 30°C) and 8 h (891.3 μmol m−2 s−1, 96.4 μW cm−2 UV-B, 34°C), respectively, and the second leaf from bottom to top of the seedlings were harvested separately. Expression levels of OsCRY1a (A), OsPhyA (B), OsPhyB (C), OsUVR8a (D), OsUVR8b (E), OsCOP1 (F), OsHY5 (G), OsPIF3 (H), OsCHS1 (I), OsPDX1.2 (J), OsPHR (K), OsPHRL (L), OsMPK3 (M), OsMPK12 (N), OsMPK13(O), and OsMYB4 (P) were analyzed and ACTIN was used an internal standard. The mean gene expression levels ± sd (n = 3) in the different plants exposed to natural sunlight at 0 h were compared statistically and those assigned with different letters were significantly different. The same analyses were performed with the plants exposed to natural sunlight for 8 h. All analyses were determined using one-way ANOVA with the means separation post hoc Student–Newman–Keuls test (P < 0.05).

