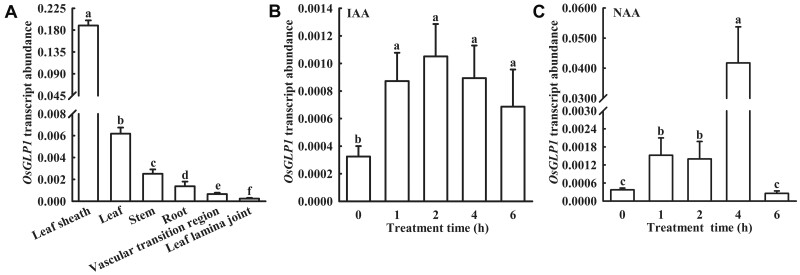
Figure 8.
Analysis of OsGLP1 expression using RT-qPCR. OsGLP1 expression in various tissues of booting stage rice (A) and in leaves of rice seedlings at the 5-leaf stage treated with 10 μmol L−1 IAA (B) and 1 μmol L−1 NAA (C) at various time points was analyzed and ACTIN was used as an internal standard. The means ± sd (n = 3) of gene expression levels assigned with different letters were significantly different as determined by one-way ANOVA with Student–Newman–Keuls test (P < 0.05).

