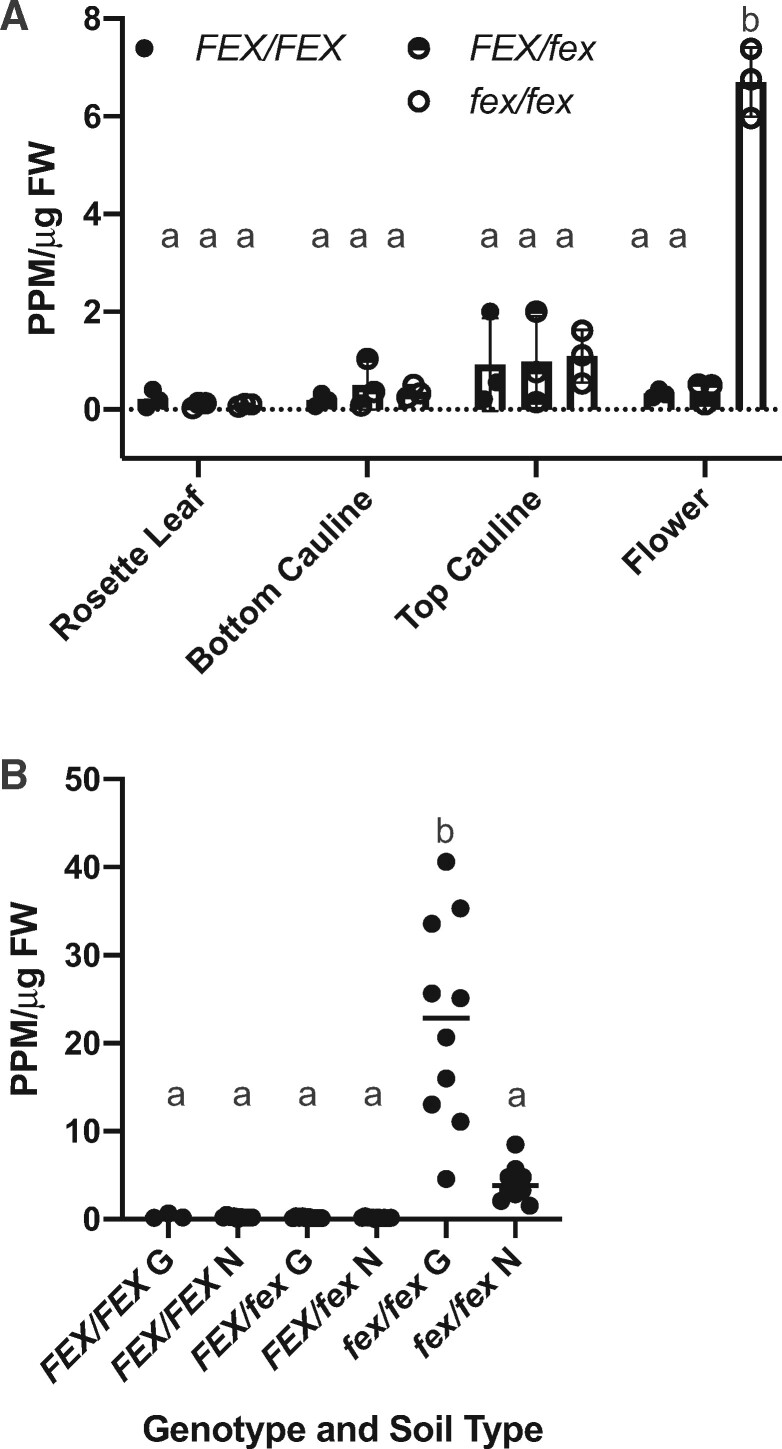
Figure 10.
FEX mutant plants accumulate fluoride in the flowers. A, Samples from plants growing on growth substrate with low fluoride (∼2-μM) exhibited continued fluoride accumulation in the flowers of mutants. The top of the bar indicates the mean and error bars are SD. B, A comparison of flowers of plants on two growth substrates Growing mix #2 (∼2-μM fluoride; G) and Nursery mix (∼0.6-μM fluoride; N) demonstrated accumulation in mutants in proportion to the fluoride in the substrate. The horizontal bar indicates the mean. A and B, Each point represents one biological replicate. Lower case letters above data points indicate statistically significant differences P < 0.0001 as calculated by one-way ANOVA (multiple comparisons, Tukey).

