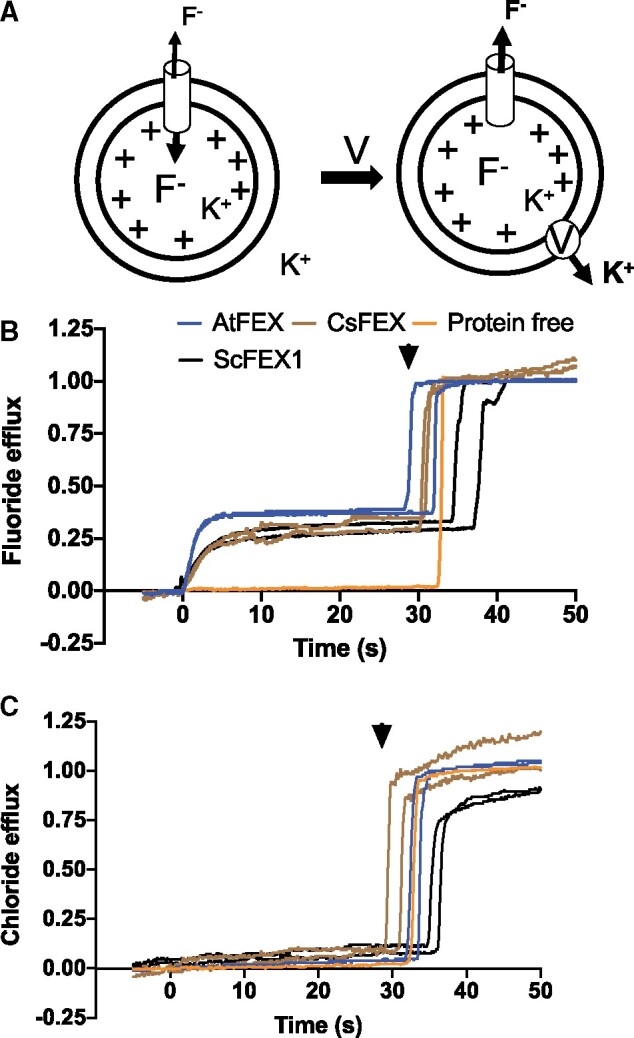
Figure 3.

AtFEX, CsFEX, and ScFEX1 efflux F− but not Cl−. A, Model of in vitro assay using proteoliposomes with an inside concentration of 150-mM KF (pH 7) and an outside concentration of 1-mM KF (pH 7). Valinomycin (V) was added at time 0 (arrow), creating a chemical gradient and efflux of ions. B, Relative fluoride efflux by ScFEX1 (black), AtFEX (blue), CsFEX (brown), or no FEX (orange), as detected with a fluoride ion selective electrode-based probe. The Y-axis represents negative voltage versus time, where the negative voltage has been transformed into nanomoles of ions based on a calibration with an ion standard and then compared with how many nanomoles of fluoride ions there were in all liposomes. C, Instead of F−, Cl− ions were loaded into proteoliposomes and efflux was detected with a chloride specific electrode–base probe. Arrowheads indicate the approximate time of β-OG addition to break open proteoliposomes and release trapped ions.
