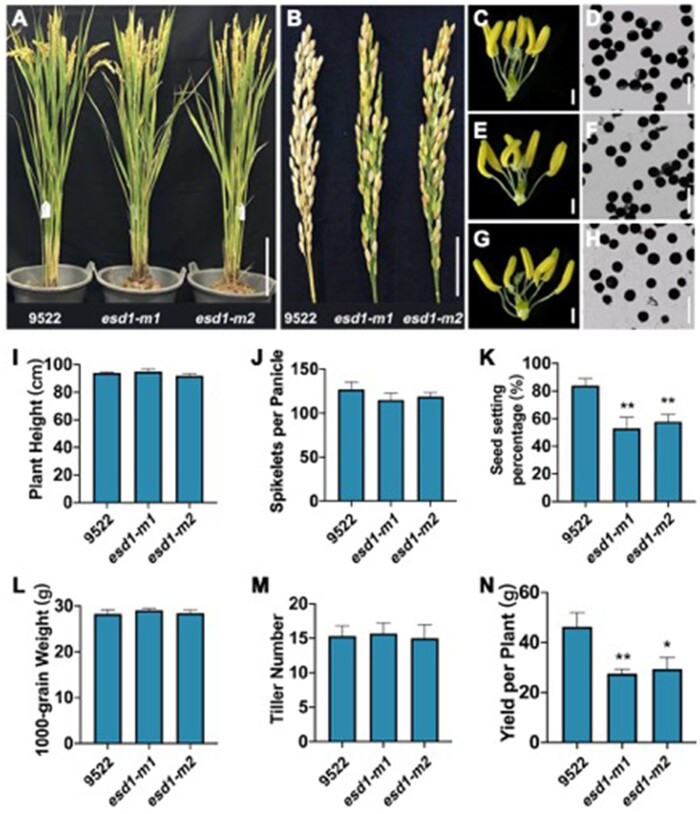
Figure 4.
Phenotype identification of esd1 mutants. A, Plant morphology of esd1 mutants; Bar = 20 cm. B, Panicle types of esd1 mutants; Bar = 4 cm. C, Anthers of 9522; Bar = 600 μm. D, Microscopy of 9522 pollen grains; Bar = 100 μm. E, Anthers of esd1-m1; Bar = 600 μm. F, Microscopy of esd1-m1 pollen grains; Bar = 100 μm. G, Anthers of esd1-m2; Bar = 600 μm. H, Microscopy of esd1-m2 pollen grains; Bar = 100 μm. I, Plant height of esd1 mutants. J, Spikelets per panicle of esd1 mutants. K, Seed setting rate of esd1 mutants. L, 1,000-grain weight of esd1 mutants. M, Tiller number of esd1 mutants. N, Yield per plant of esd1 mutants. Error bars indicate sd (n = 15); Asterisks indicate significant difference by Student’s t test (*P < 0.05 and **P < 0.01).

