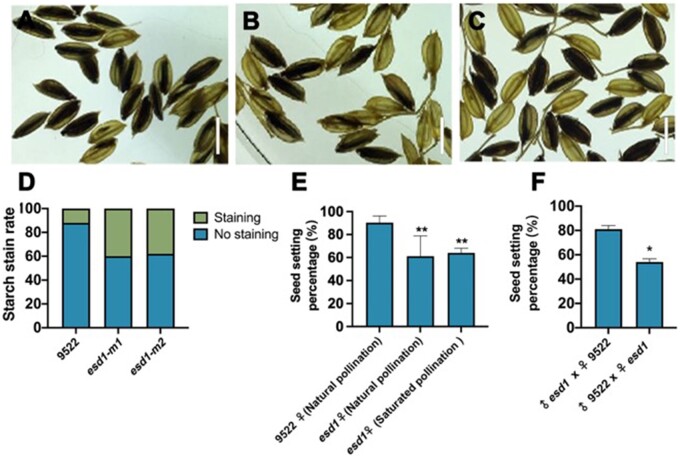
Figure 6.
Fertilization and hybridization detection of esd1 mutants. A–C, Embryo sac fertilization results of 9522, esd1-m1, and esd1-m2; Bars = 7 mm. D, Starch stain rate of 9522, esd1-m1, and esd1-m2. E, Natural pollination of esd1 mutants and saturation pollination of esd1 mutants with 9522 pollens; Error bars indicate sd (n = 7). F, Reciprocal crosses between 9522 and esd1-m1; Error bars indicate sd (n = 3). Asterisks indicate significant difference by Student’s t test (*P < 0.05 and **P < 0.01).

