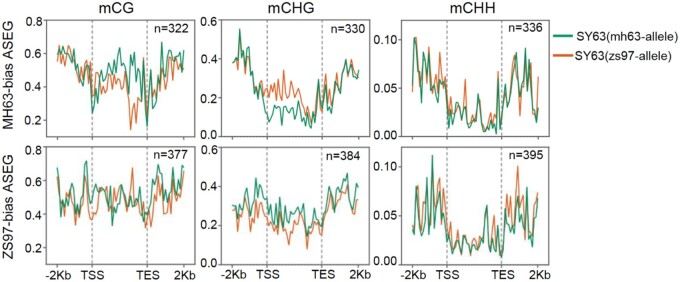
Figure 1.
Metaplots showing CG, CHG, and CHH methylation relative to the transcription start sites and end sites (TSS and TES, respectively). Plots are shown for MH63 parental alleles (green) and ZS97 parental alleles (orange) of MH63-biased or ZS97-biased allele-specific expressed genes in the SY63 hybrid rice panicle. Notably, there is an inverse correlation between gene body CHG methylation and allele expression. Adapted from Ma et al. (2021).

