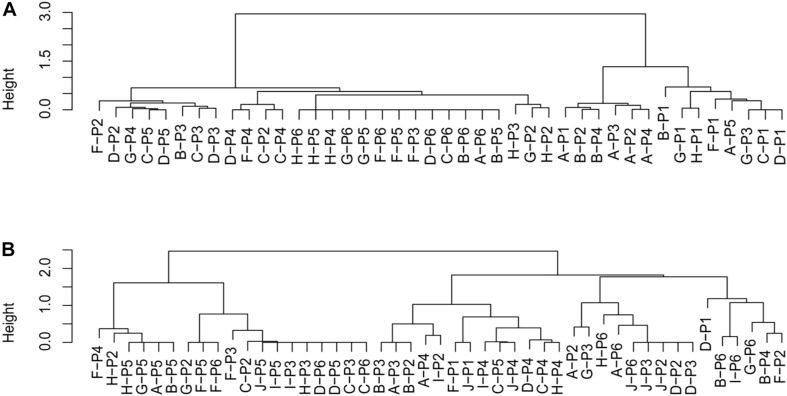
FIGURE 3.
The hierarchical clusters of duration of each action in each area before and after the alteration [(A) dendrogram of before the alteration, (B) dendrogram of after the alteration]. The height, shown on the y-axis, means the similarity between action durations in the given area. The letters in dendrograms indicate each area (A, sandbox; B, slide; C, tires; D, open; F, woodstep; G, woodslope; H, tower; I, mound; and J, track).

