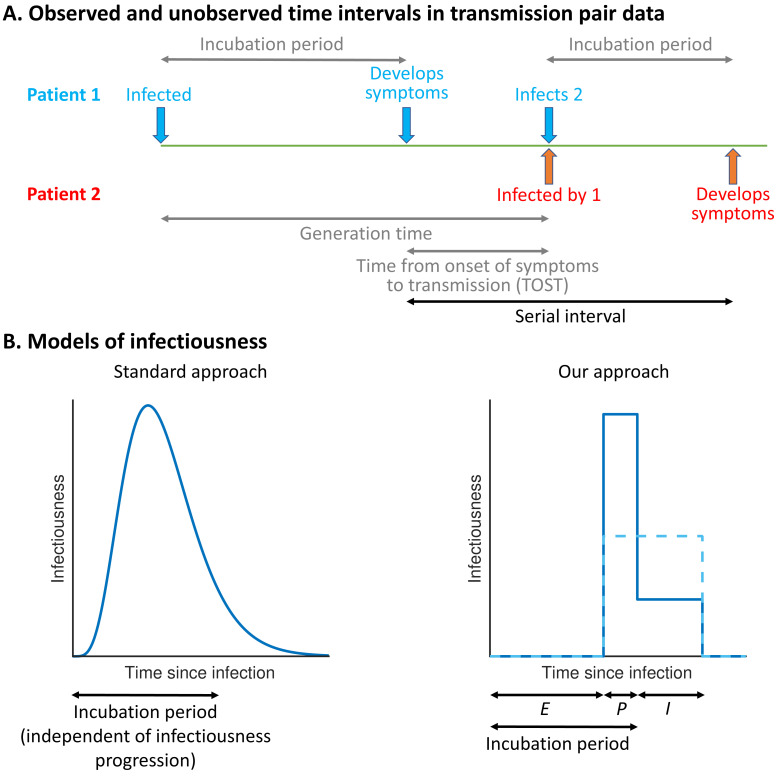
Figure 1. Schematic illustrating epidemiological time intervals in data from infector–infectee transmission pairs and approaches for inference from transmission pair data.
(A) Transmission pair data generally comprise symptom onset dates for known infector–infectee pairs. These data may be supplemented with partial information about infection times, consisting of a range of possible exposure dates for infectors and/or infectees (Ferretti et al., 2020a). While the serial interval for each pair can be calculated directly from the data (with some uncertainty, given the unknown precise times of symptom appearance on the onset dates [Thompson et al., 2019]), other time intervals, including the generation time and TOST, are unobserved (these are shown in grey). (B) In standard approaches (left panel) for inferring infectiousness profiles from transmission pair data, the infectiousness of a host at a given time since infection is assumed to be independent of their incubation period. In our approach (right panel), we link a host’s infectiousness with when they develop symptoms. We assume that individuals are not infectious during the latent (E) period and that infectiousness may either vary between the presymptomatic infectious (P) and symptomatic infectious (I) periods (solid line – this corresponds to our ‘variable infectiousness model’), for example due to changing behaviour in response to symptoms (Manfredi and D’Onofrio, 2013), or be identical in these two time periods (dashed line – this corresponds to our ‘constant infectiousness model’).

