. 2021 Apr 26;10:e65534. doi: 10.7554/eLife.65534

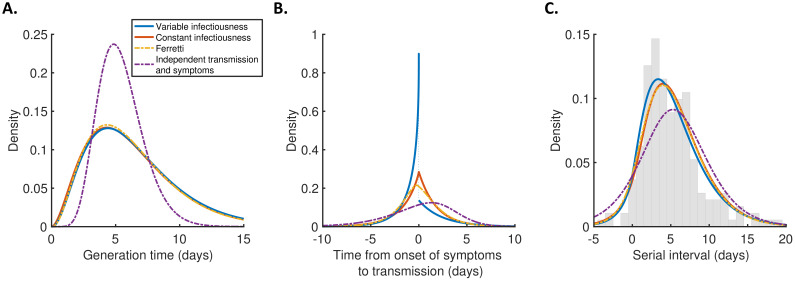
Figure 2. Distributions of epidemiological time intervals.

Distributions of epidemiological time intervals estimated by fitting different models to data from 191 SARS-CoV-2 transmission pairs (Figure 2—source data 1). (A) Generation time, indicating the relative expected infectiousness of a host at each time since infection. (B) Time from onset of symptoms to transmission (TOST), indicating the relative expected infectiousness of a host at each time since symptom onset. (C) Serial interval, indicating the periods between infectors and infectees developing symptoms. In (C), the empirical serial interval distribution from the transmission pair data (Figure 2—source data 1) is shown as grey bars. In addition, discretised versions of the serial interval distributions, calculated using the method in Cori et al., 2013, are shown in Figure 2—figure supplement 1. In all panels, lines represent: variable infectiousness model (blue), constant infectiousness model (red), Ferretti model (orange dashed), and independent transmission and symptoms model (purple dashed). We assumed a specified incubation period distribution (Lauer et al., 2020) when fitting the different models to data (see Materials and methods); equivalent panels using an alternative incubation period distribution (Linton et al., 2020) are shown in Figure 2—figure supplement 2.

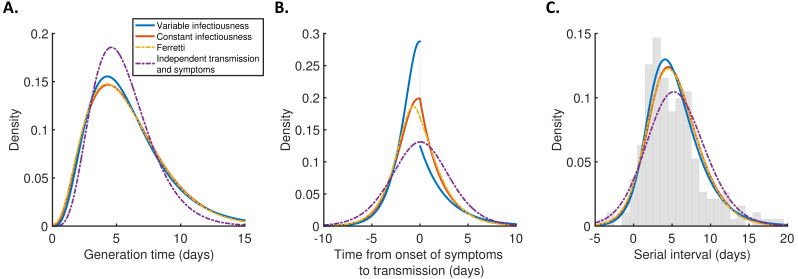
Figure 2—source data 1. Transmission pair data.
Data comprising symptom onset dates and (where available) intervals of possible exposure times in 191 SARS-CoV-2 infector–infectee pairs. These data were originally reported in five different studies (Ferretti et al., 2020a; He et al., 2020; Xia et al., 2020; Cheng et al., 2020; Zhang et al., 2020), and were previously compiled in Ferretti et al., 2020b.

Figure 2.

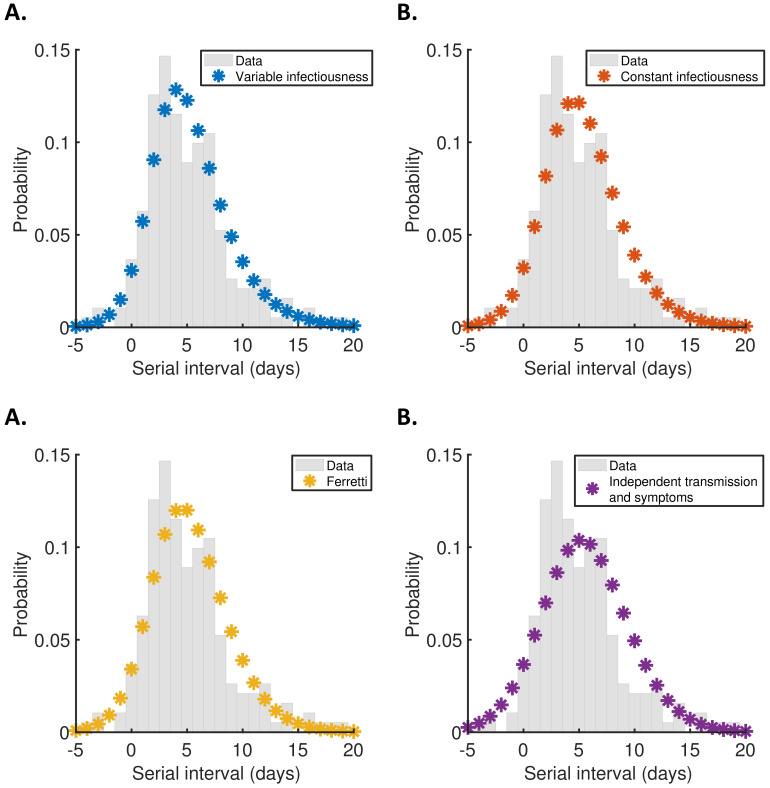
Figure 2—figure supplement 1. Discretised serial interval distributions.

Figure 2—figure supplement 1.

Discretised versions of the serial interval distributions shown in Figure 2C, calculated using the method in Cori et al., 2013, plotted as stars alongside the empirical serial interval distribution from the transmission pair data (grey bars). (A) Variable infectiousness model. (B) Constant infectiousness model. (C) Ferretti model. (D) Independent transmission and symptoms model.

Figure 2—figure supplement 2. Robustness to the assumed incubation period distribution.

Figure 2—figure supplement 2.

Equivalent panels to Figure 2 for an alternative incubation period distribution (Linton et al., 2020). ΔAIC values for the different models are 0 (variable infectiousness model), 5.1 (constant infectiousness model), 10.2 (Ferretti model), and 64.5 (independent transmission and symptoms model).