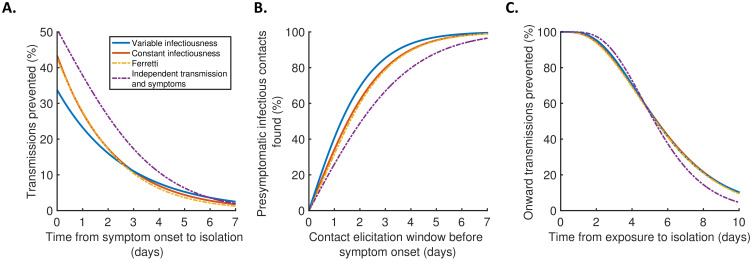
Figure 4. Implications for isolation and contact tracing.
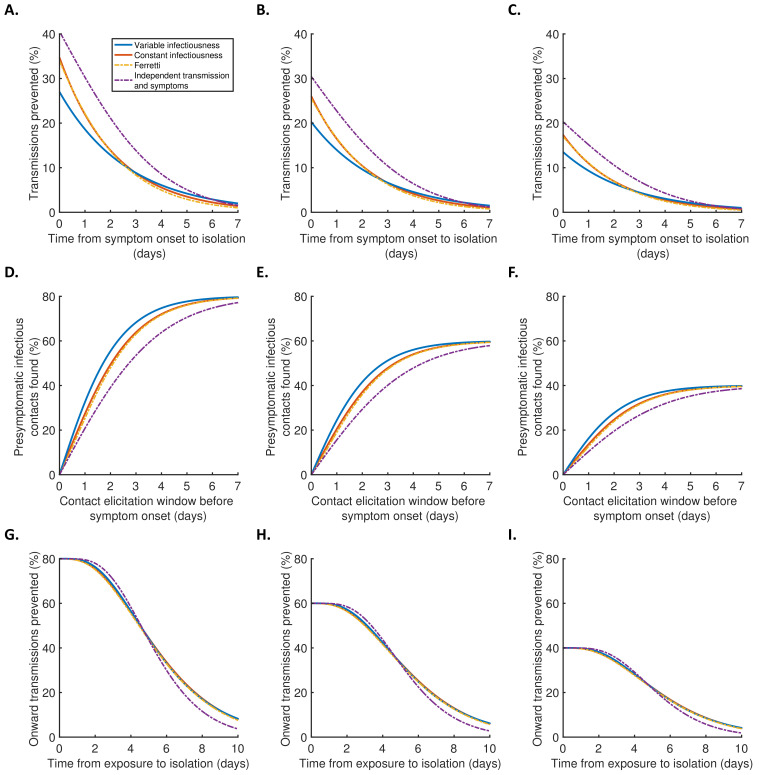
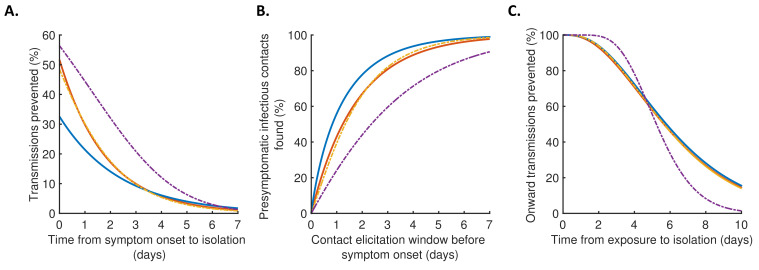
(A) Effect of the timing of isolation of symptomatic index cases: the proportion of transmissions prevented through isolation, for different time periods between symptom onset and isolation. (B) Effect of the contact elicitation window: the proportion of presymptomatic infectious contacts found for different times up to which contacts are traced before the symptom onset time of the index host. (C) Effect of the timing of isolation of infected contacts: the proportion of onward transmissions generated by the contacts prevented by isolation of those contacts, for different time periods between exposure to the index host and isolation of the contacts. In all panels, lines represent predictions obtained using point estimate parameters for the variable infectiousness model (blue), constant infectiousness model (red), Ferretti model (orange dashed), and independent transmission and symptoms model (purple dashed). Here, isolation and contact tracing are assumed to be 100% effective; equivalent panels in which the effectiveness is less than 100% are shown in Figure 4—figure supplement 1. Equivalent panels assuming an alternative incubation period distribution (Linton et al., 2020) are shown in Figure 4—figure supplement 2.


